This article serves as a guide for store managers to log in and utilise the DotActiv Planogram Execution (TrueView) tool. This tool will simplify the planogram implementation process for stores and provide statistics regarding compliance towards the planogram.
Logging Into TrueView
- Click on the following URL to access the DotActiv TrueView site: TrueView Planogram Execution tool.
- Log In Details: Name_Surname for both username and password. For stores, it will be Store Code_Store Name. For ad hoc users like regional managers and such, it will be Name_Surname as the username and 12345 as the password; these users are expected to change their password once they log in.
- Should you struggle to log in, please contact criticalsupport@dotactiv.com
- Store Managers and Regional Managers will only be able to view information regarding the store/s allocated to them.
Planogram Implementation View
The Planogram Implementation view, located in the “Workflow” dropdown, is allocated to all Store Manager roles and will indicate all implementable planograms for your store.
To navigate through the list of planograms, you can drill down into the hierarchy menu, which follows the hierarchy levels from the integrated DotActiv database.
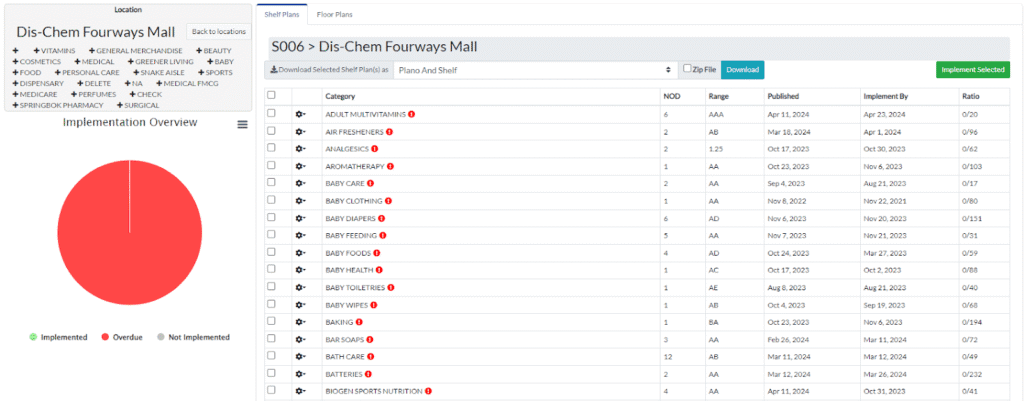
The information provided regarding the specific planogram includes the Category, Number of Drops (NOD), Range, Published Date, Implemented By date and Ratio.
The Category indicates the category relevant to the planogram. The NOD indicates the number of drops that the planogram has. The Range identifies which cluster the planogram forms part of. The Published date refers to the date on which the planogram was uploaded by DotActiv for implementation, whereas the Implement By date is the suggested date on which the planogram would be implemented in the store and usually provides two weeks from the Published date. Any planograms that have not been implemented by the Implement By date will be shown as overdue. The Ratio shows how many of the planograms for that category that are allocated to your store have actually been implemented.

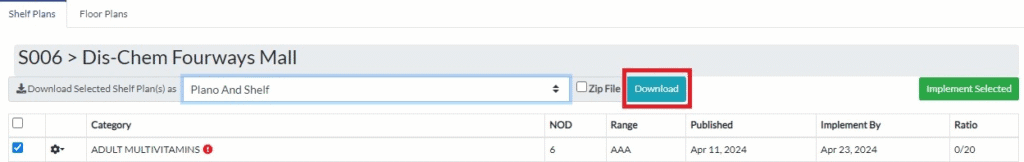
After locating the relevant category for implementation, you can select the planogram to download the file. Select the format in which you would like to download the planogram from the drop-down menu. Lastly, click “Download”. Should you wish to download multiple files, select the ‘Zip File’ option.
Additionally, you can also indicate planograms as ‘implemented’. Simply click on the “Implement Selected” button. You will then be able to add a comment and attach a file as proof of implementation. Store Managers are also encouraged to add any planogram suggestions or implementation struggles to the comment section.
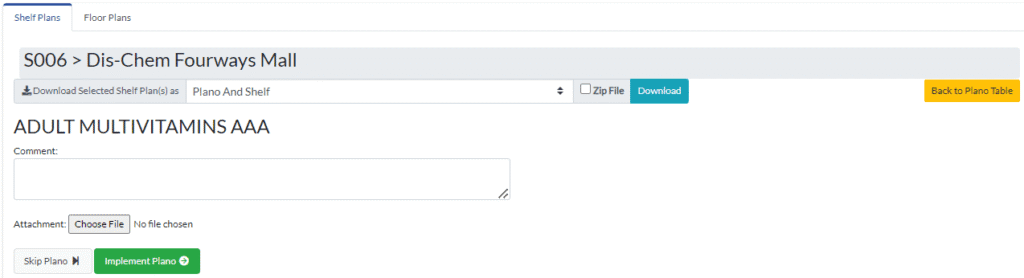
You can either choose to go back to the “Plano Table” or you also have the option to “Skip Plano” should the planogram allocation be wrong or should you wish to not complete the implementation process for a specific planogram.
How To View A File, Planogram Details, Or Report A File
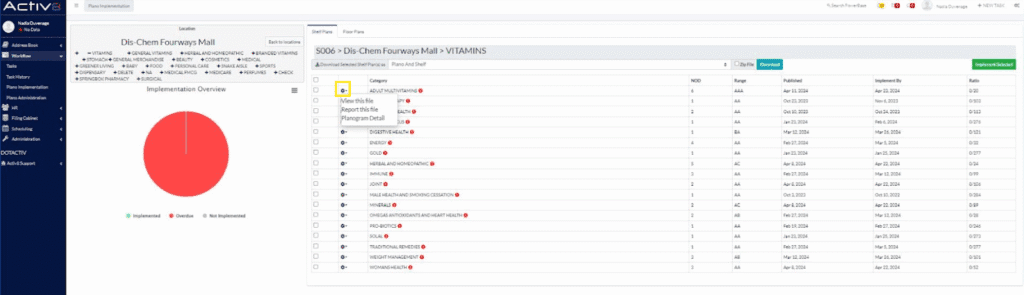
You also have the option to view the planogram file, the planogram details, or to report it.
Simply click on the “Settings” icon and select an option as shown below.
View This File
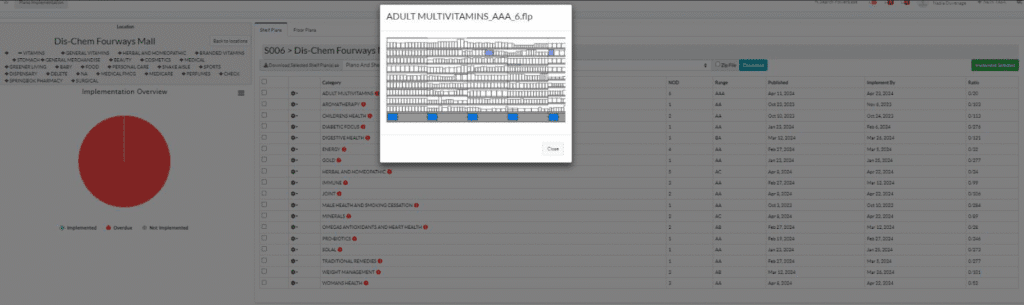
When selecting the ‘View This File’ option, the planogram will appear in a pop-up on your screen.
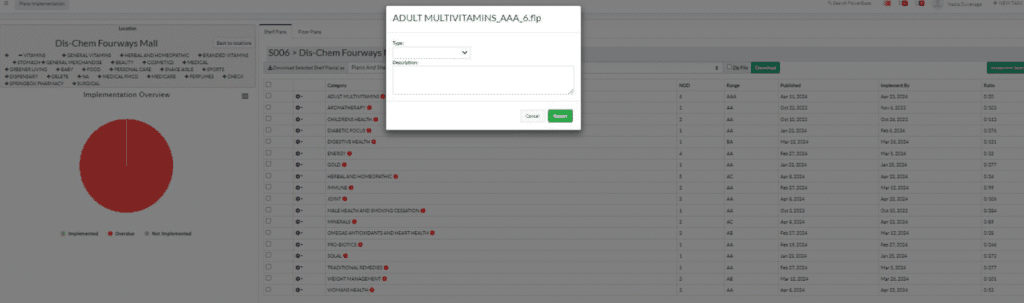
Report This File
In the instance of the wrong planogram allocation or the file being corrupt, this option will allow you to report the file and add a comment.
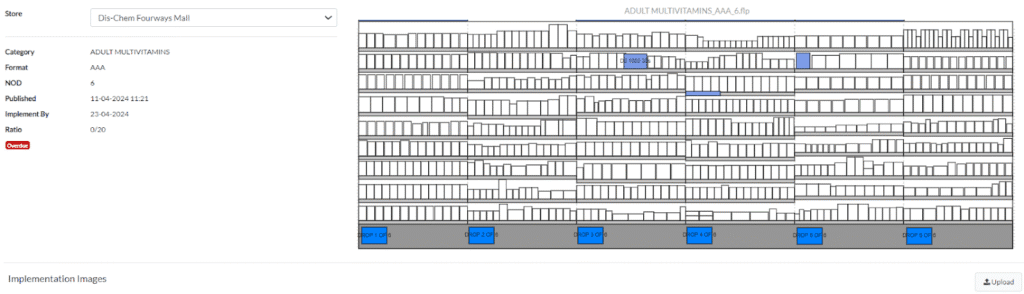
Planogram Details
This view will allow you to view specific details regarding the planogram and provide a larger view of the planogram on your screen. Additionally, you are also able to upload in-store images of the planogram that has been implemented. Simply click on the ‘Upload’ button in the bottom right corner.
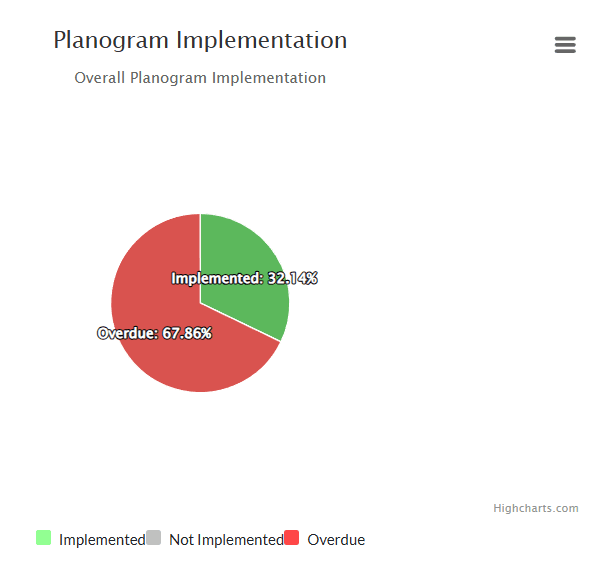
Implementation Overview Graph
The pie chart labelled “Implementation Overview” indicates the number of implemented (green), non-implemented (grey) and overdue (red) planograms for the selected store.
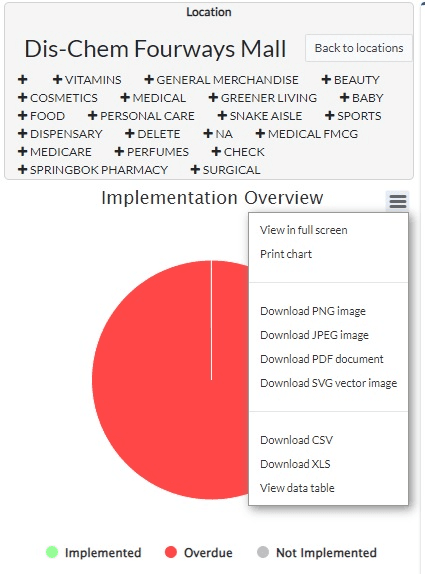
The menu option in the top right corner allows for further actions regarding the planogram implementation overview. For instance, clicking on the ‘Download CSV’ or ‘Download XLS’ options will supply the implementation data in an Excel format.
Planogram Administration View
The Planogram Administration view is allocated to the ‘admin’ role on TrueView, which will include selected users, Buyers and DotActiv consultants.
By having an ‘admin’ role, you will have access to all Planogram Implementation information (kindly refer to the first section of this user guide) and an overall view of all planograms allocated to all stores. Simply put, the Planogram Administration view has all the functionality as explained for the Implementation view; however, this is only on a total category/planogram level.
Should you wish to view planograms by store, kindly go to the Planogram Implementation view.
*Please note that only DotActiv consultants are allowed to archive planograms.
*Please note that external users are not required to populate your profile with any personal or employment information.
Planogram Reports
The Plano Reports are used to provide the user with an overview of planogram implementation for all sites/stores assigned to their profile. This would be used on a regional manager or head-office administrator level. You can find these reports on the ‘Supplier Portal Dashboard’.
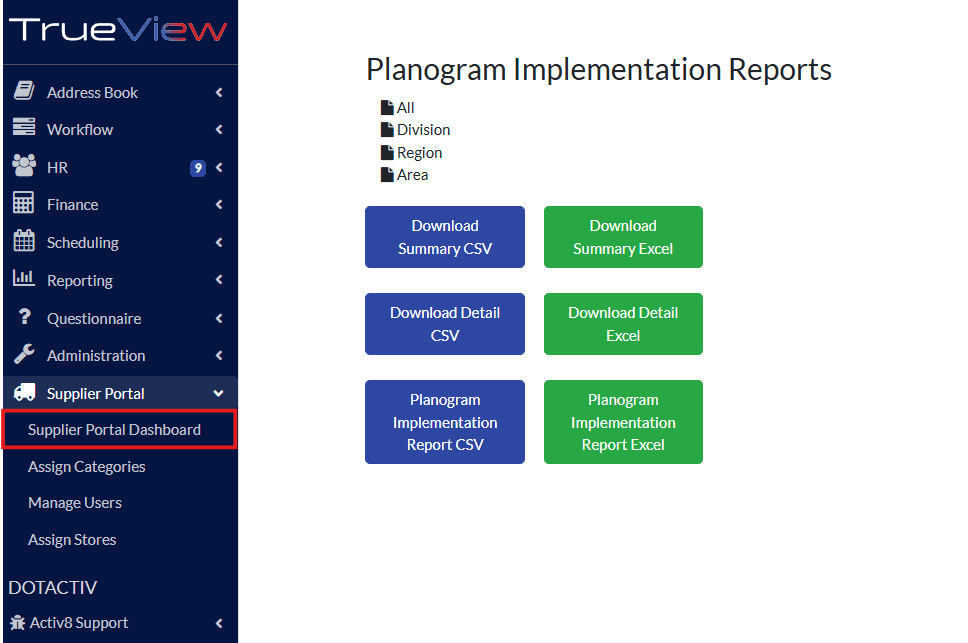
There are three available reports:
1. Summary CSV or Excel
This is an overview of each store, per region, and its total implementation statistics. The % of implemented, not implemented, and overdue planograms is shown.
2. Detail CSV or Excel
This report indicates the status of each planogram assigned to each store, and also how many days a planogram has been overdue for implementation.
3. Planogram Implementation Report CSV or Excel
This provides an overview of all planograms implemented per store, including an image of their implementation and the date they were implemented.
Please note: when downloading these reports in CSV, ensure that you format them correctly to view the information (Text To Column).
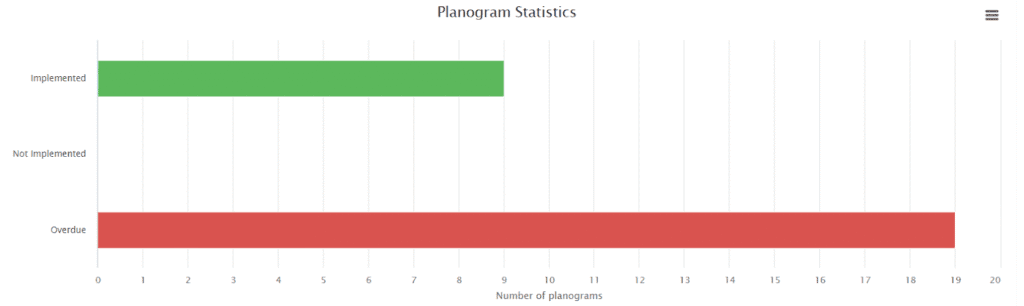
Additionally, the user also has a visual of the planogram implementation statistics in the form of a pie chart and bar graph:ms.