The purpose of this article is to help guide you on how to use the Floor Plan Analysis Grid and Floor Optimizer. We also unpack the Update Floor Plan function features found in the DotActiv software.
Pre-Requisites
To be able to use the above features in the Dotactiv software, the following prerequisites must be in place:
- The user needs to be on an integrated DotActiv database.
- The cluster grid must be populated with market information such as store code, store name, cluster names ( if available), number of drops (NODs), and categories. Please note, the NODs must be populated in Cluster Maintenance in order for the report to populate correctly.
- The floor plan in review must be linked to the cluster grid and database via the store code. This is done by populating the store detail information tab under the market fields in the floor plan properties.
Please see the gif below.
What Is The Floor Plan Analysis Grid?
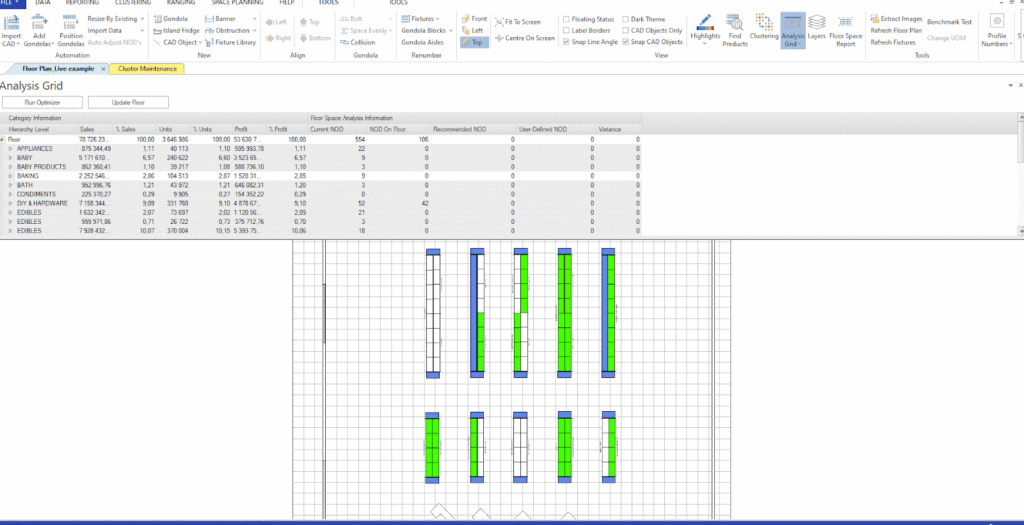
The floor plan analysis grid feature in the DotActiv software enables you to perform a pre-analysis of your current floor plan by comparing the departments, categories, and current NODs per category against what is captured in the cluster grid in the live database.
The pre-analysis also includes performance data and KPIs that can be selected ( through a drop-down menu) and applied to the current floor plan based on the data in the database. At this point, there is no software NOD analysis or recommendation until the user runs the floor plan optimizer for post-analysis.
To view the floor plan analysis grid, open your current floor plan, and ensure that you are in the ‘Tools’ tab. Next, scroll to the ‘ Analysis Grid’ icon on your right and double-click to open.

How to Add the Saved Floor Analysis Information To The Floor Plan For Use In Custom Reporting
Step 1: Open a saved Floor Plan on the DotActiv Software.
Once opened, move to the right side of the tools bar and click on ‘Analysis Grid’ under View. Scroll through the Analysis Grid to ensure the information is correct and, thereafter, click save.
Step 2: Open the Custom Report.
Select ‘Generate a Report’. Once opened, click on ‘Data Grid’. On the Grid properties, in the Grid bar, click on the ‘Grid Type’ drop-down and select Floor Analysis. Thereafter, click on Setup and tick the box to use saved analysis. Click on ‘OK’, save, and exit.
Step 3: Add the saved Floor Analysis to a Report.
Click on ‘Custom Report’ and select a Report. Link the Report to the saved Floor Plan under ‘Map To’ and click OK to view the saved Floor Analysis.
What Is The Floor Optimizer?
The floor optimizer feature in the DotActiv software is used to select Departments and categories on your floor plan that you would like to optimize by performing a cross-category analysis to recommend the ideal space allocation (NODs).
How Does It Work?
Step 1: Department Selection
The Floor Optimizer tool uses a wizard setup that guides you through the process. You can see which step of the process you are currently on and you can click next to move to the next step.
Start by selecting the Departments that you would like to analyse. If you would like to analyse all departments on the floor plan, simply click on Department and all departments will be selected.
Step 2: Data Period Selection
Pick your period of data as specified in your first consultation if you are a DotActiv employee or any time period you wish to use if you are a DotActiv client.
It is recommended to use at least 12 months of data to accommodate seasonal categories.
Step 3: KPIs
The Floor Optimizer tool has set KPIs to select from when performing the floor plan post-analysis. The average contribution of the selected KPIs will be used to calculate system-recommended space allocation across all categories on the floor plan.
Understanding the Floor Planning KPIs
%Sales: % of Sales within the hierarchy level; Sales as a percentage of the parent items total.
%Units: % of Units within the hierarchy level; Units as a percentage of the parent items total.
% Profit: % of Profit within the hierarchy level; Profit as a percentage of the parent items total.
% Cubic: % of Cubic Space used on the floor within the hierarchy level; Cubic space used as a percentage of the parent item’s total cubic space.
GMROI: Gross margin return on investment for all products (Total Profit / Store Stock At Cost); Profit divided by Store Stock At Cost.
Stock Turn: Average stock turn for all products (Total Sales / Store Stock At Cost); Sales divided by Store Stock At Cost.
Trade Density: Total Sales per NOD; Sales divided by number of drops.
Congestion: Congestion of the current planogram.
Days Of Supply: Days of Supply of the current planogram.
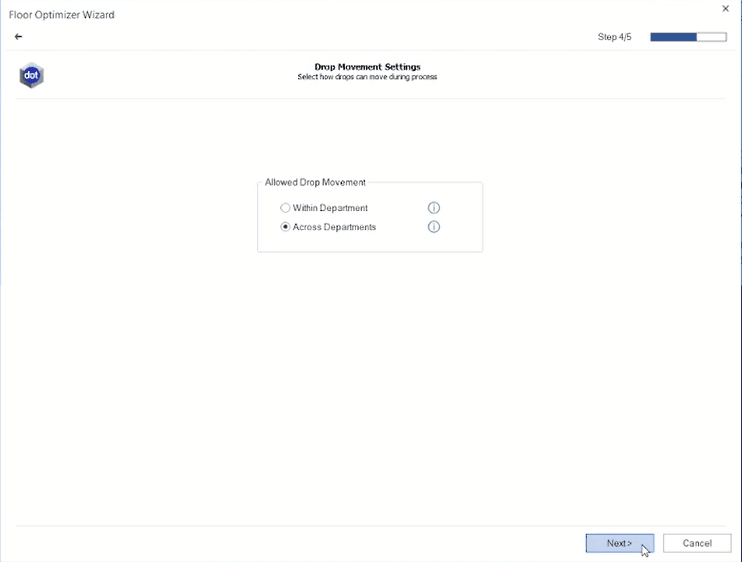
Step 4: Drop Movement Settings
This setting allows you to choose between ‘Within Department’ and ‘Across Department’. Within Department, the NODs per category are optimized within a department, with the department’s total NOD being maintained. In Across departments, NOD is optimized across all selected departments allowing department NODs to be optimized.

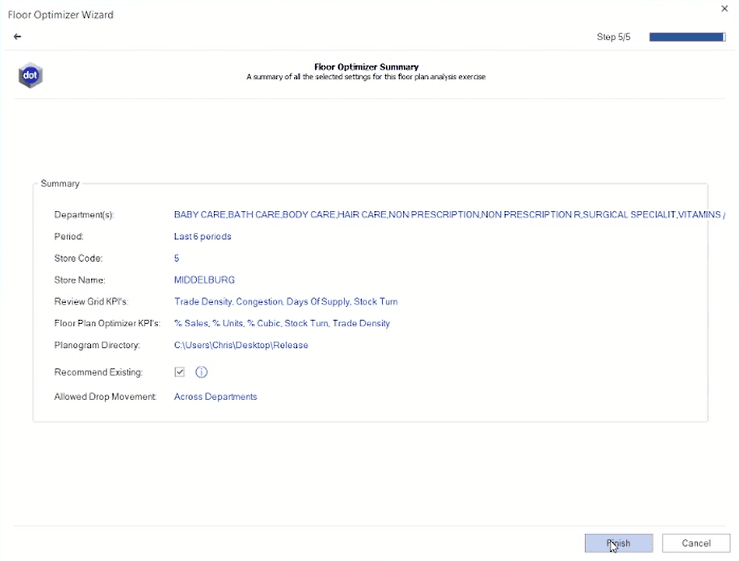
Step 5: Plan Summary
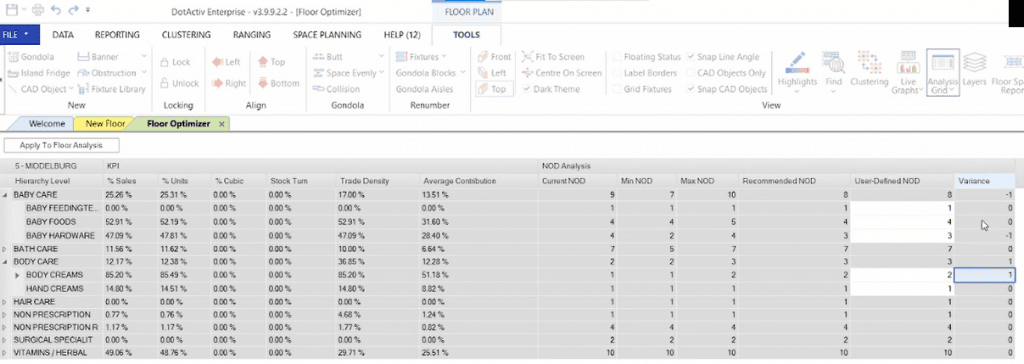
Review the ‘Plan Summary’ to ensure all data is correct. Press ‘Finish’ to run the setup if all is in order. An analysis grid with performance data by department, by category, with the recommendation, drop movement, and an option for user-defined NOD will appear.

The Analysis
Current NODs
Is what is captured and active in the cluster grid until the user applies the final NOD changes to update the database.
Min NODs and Max NODs
These are the minimum and maximum drop variations within each cluster as per the cluster grid. They assist the user to observe the minimum and maximum threshold when overriding and recommending the final NODs.
Recommended NODs
This NOD recommendation is based on the selected KPIs. It calculates the space based on the average contribution of the selected metrics. In the results, it is possible for a whole department to overall lose NODs based on the recommendation that another can gain.
User Defined NODs
The user-defined input can be used to override the system-recommended NODs. If not changed, the user-defined NODs default to the system-recommended NODs. Additionally, the user-defined inputs will be highlighted in green if the NOD is available in the database, or alternatively, it will be highlighted in red if the NOD is unavailable.
Variance
The proposed change to the NOD from the current value to the user-defined NODs. This indicator also shows where the User-Defined NOD is greater or less than the recommended NOD. With the ‘Across Departments’ setting, the total NODs can spread across any category.

Icons and Valid/Invalid NOD highlights
The software allows the user to edit the user-defined NOD on the analytics grid. The software will bring attention to the changes by using highlights and indicators to show the differences between recommended, user-defined and the current NOD.
Floor Impact Analysis
The section “Impact Analysis” in the optimizer view shows the estimated impact of the optimized NOD per Category.
The Impact is estimated by comparing stores that currently use the optimized NOD to the current store.
“Trading Density Change” – compare the average of other stores to the current.
“Days of Supply Change” – requires an FLP for the optimized NOD to exist in the database FLP storage.
“Different Format Used” – an indicator to show if the comparison stores use a different format to the current store
Changes made in the User-Defined NOD column will result in the software producing results in the columns that follow, namely; Variance, % NOD change, trading density change, days of supply change and different formats used.
Update Floor Plan Function
Once the user is happy with the final NOD changes, they use the apply changes to the floor plan analysis button to communicate the new changes to the post-analysis grid. The ‘Update Floor’ function or button is used to apply the new changes to the floor plan by creating missing category planograms and the new recommended drop variation planograms.
