The purpose of this article is to offer you a clear step-by-step process to add a grid to a report template while working in the DotActiv software.
Adding A Grid
After opening the DotActiv software, ensure you are in the ‘Reporting’ tab.
Once there, navigate to the ‘Advanced’ section and click on the drop-down arrow next to ‘Custom Report’. Select ‘Report Builder’.
The ‘Custom Report Builder – Templates’ window appears. Here, you can either choose an existing template or create a new one.
After selecting your chosen report, you’re taken to your report. On the left, you’ll find a dockable window labelled ‘Objects’. From here, you can add a data grid. Either drag and drop it or click on the report.
This opens the ‘Custom Report – Grid Properties’ window as seen below.
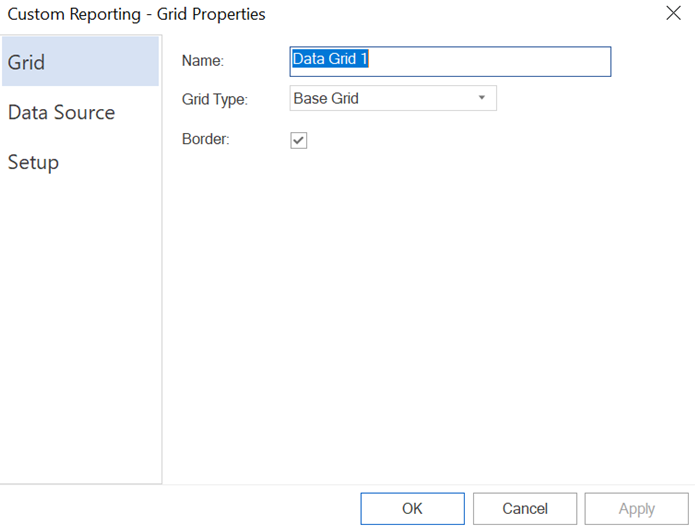
First, in the ‘Grid’ section, give your grid a name.
You can now select the type of grid that you would like to add. From the drop-down menu, you have the option to select a Base Grid or any of the planogram-based grids such as the Plano Analysis, Shelf Report, Fixture Report, Gondola Report, or Changes Report. Additionally, there are floor planning grids such as the Floor Analysis Report and Floor Changes Report.
Note: The changes report requires 2 different floors with the same name while the analysis grid requires a database connection.
Then navigate to the ‘Data Sources’ section, click on ‘Add/Edit’ and select your data source.
Lastly, in the ‘Setup’ section, there are also other grid layout options allowing you to set columns, add calculated columns, add editable columns, set filters, place the data in specific sort order and choose which data you want to display.
When setting columns, information can be fed into three different areas or fields, namely:
- Measure Field: this is the data field that is measured such as Category, Sub Category and Brand;
- Data Field: this is the actual data that will be measured, for example, %Sales and %Unit; and
- Data Group Field: this is an optional field where multiple series will be measured. For example, when creating a Grid, the distinct values of Data Group Fields will be displayed on the table header to order the group data fields accordingly.
Within Measure Fields, the user also has the option to group values. This will create a report that has a drill-down function into each field that is marked as ‘yes’. Merely double-click on the ‘No’ or ‘Yes’ to change the grouping preference. Below is an example:

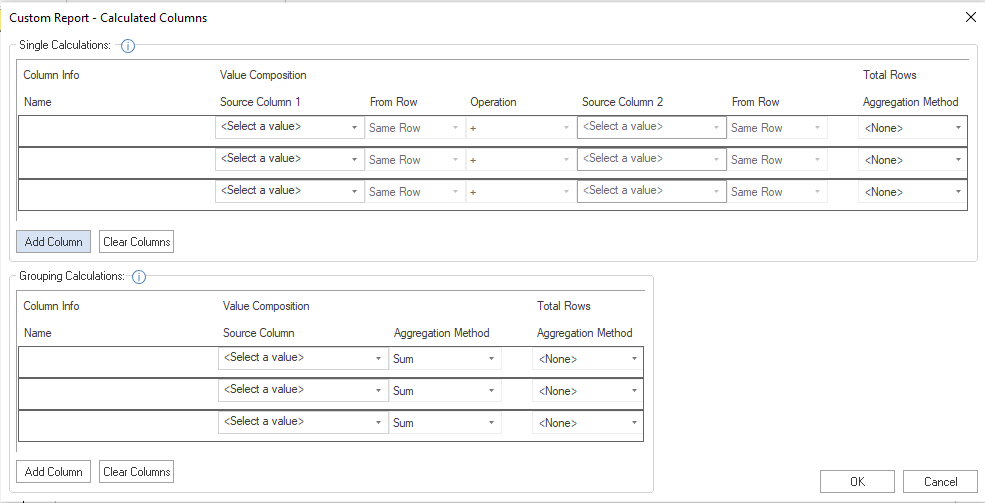
When setting calculated columns, you can use hardcode numeric values as well as % columns which could be auto-added for selected data fields. This means that you have the option to set up percentage fields and add a set value.
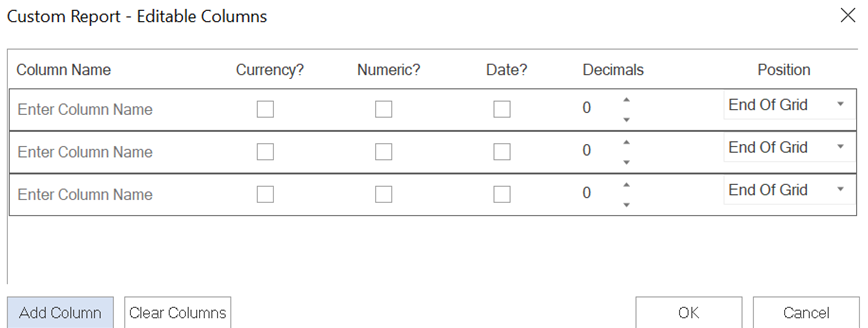
‘Editable columns’ can now be added and you can decide to set it as currency, numeric, date etc. The columns can be edited after generating/ running the report. This information will be saved if saved as a .drt file.
You can also move the grid around on your report template and edit it to your liking. To do that, right-click on the grid and select an option.
Lastly, you need to save your Custom Report. This can be done by either holding Control + ‘S’ or by navigating to ‘File’, then ‘Save’, after which you can select the directory that you want to save it in.
We recommend that you always save your report in the ‘DotActiv Data’ directory, and then under ‘Templates’. You can also give your Template a specific name and then save it.
Choosing Which Data To Display
To neaten and optimise the report, the user has the option to ‘Display Last Group Only’.
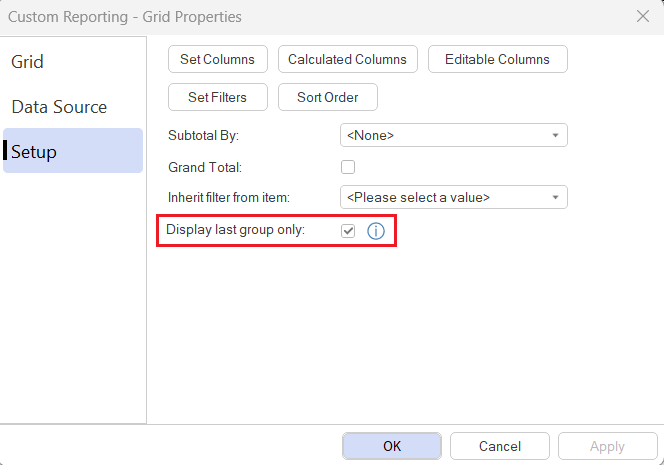
If this option is ticked, then only the last period of data will be displayed in the grid. On the other hand, all of the data in the selected data periods will be visible should the option not be ticked. Below are visuals of what each report would look like with each respective option.
All Data Displayed

Display Last Group Only
Ranking The Data
The user also has the option to rank a certain set of data. This means that should the data be ranked by Sales at Sell, an additional column would be added which indicates each Sales at Sell value’s rank within the category. Below is an example:
Grid Column Presets
Grid column presets offer a way to quickly filter and select specific columns within your grid. This feature streamlines the process of customizing your report by allowing you to apply pre-defined sets of columns, saving you time and ensuring consistency across your reports.
To create a preset, in the ‘Grid Properties’ window, navigate to ‘Setup’. Then, click on ‘Column Presets’.

In the ‘Column Grid Presets’ window, select the columns that you would like to add to the present by double clicking on the column or selecting the column and clicking on the ‘right’ arrow.

To remove a column from the preset list, simply double click on the column or select the column and click on the ‘left’ arrow.

Once you are happy with your selection, select ‘Save’. You will then be prompted to name your preset.

Should you wish to change the name of an existing preset, select the preset from the drop-down and click on ‘Rename’.

Should you wish to delete an existing preset, select the preset from the drop-down and click on ‘Delete’.

To reorder the columns in the preset, simply click on the column that you would like to reorder and select the ‘up’ or ‘down’ arrows.

To use the preset, once you have run the custom report, right click on the grey bar at the top of the grid, navigate to ‘Load Preset’ and select the preset that you would like to use.

Should the above steps not work for you, please create a support ticket and DotActiv support will assist you in uncovering the issue.