The purpose of this article is to help you insert a planogram view in a custom report and customise it to your client’s needs. It will also indicate how the criteria fields can be customised according to the fields requested by a buyer or to indicate the specific KPIs that should be measured.
Inserting A Planogram View From A Planogram Data Source
The first step will be to add the Planogram View to your Custom Report. For this you will have to open the Custom Report that you want to add the Planogram View to.
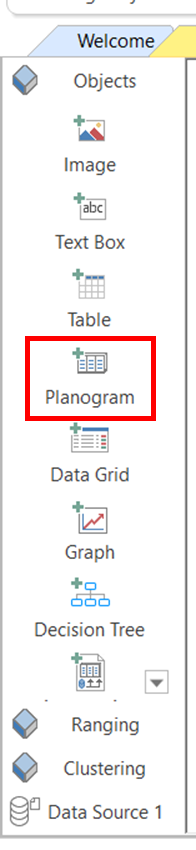
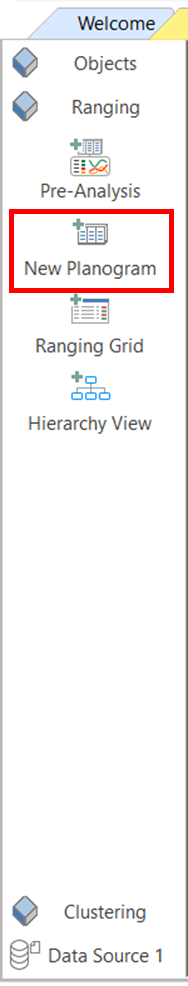
To add the Planogram View you will make use of the Planogram function on the right-hand tab under ‘Objects’.
Analyzer Grid Criteria
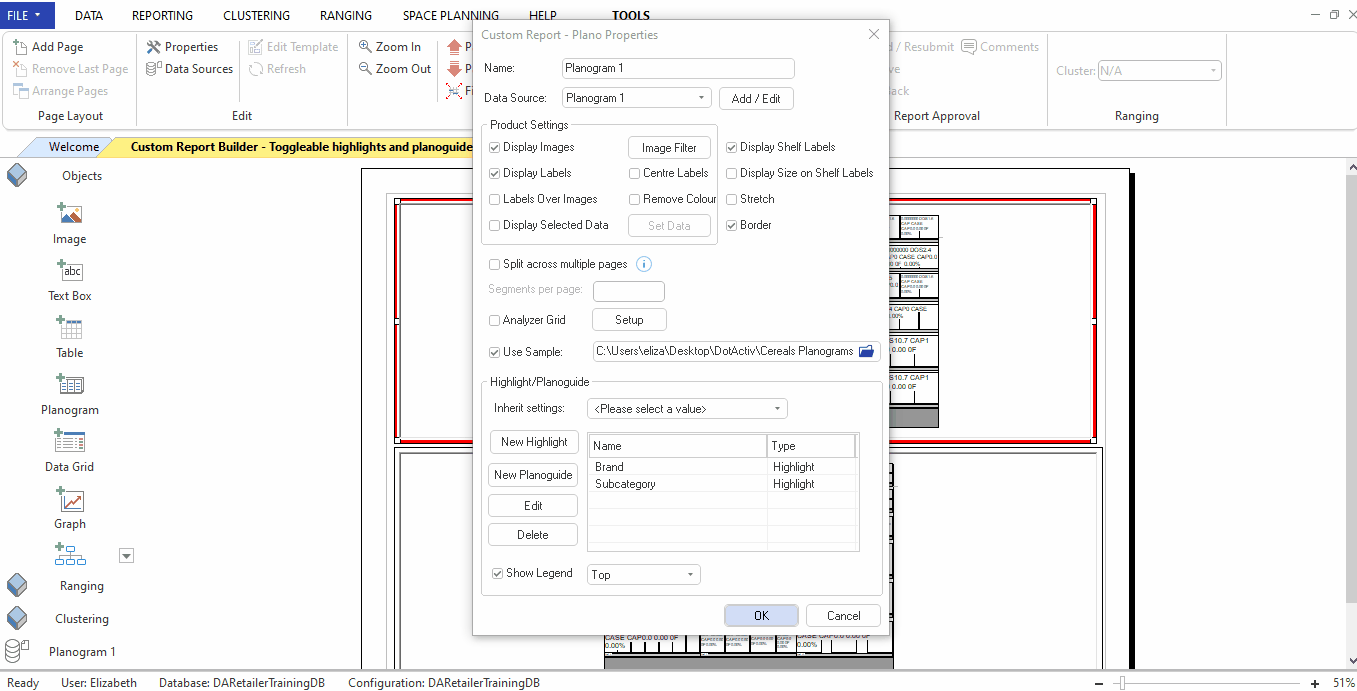
On the Plano Properties, you will add the analyzer grid criteria field custom to your needs. This can be done by selecting the ‘Analyzer Grid’ checkbox on the properties tab.
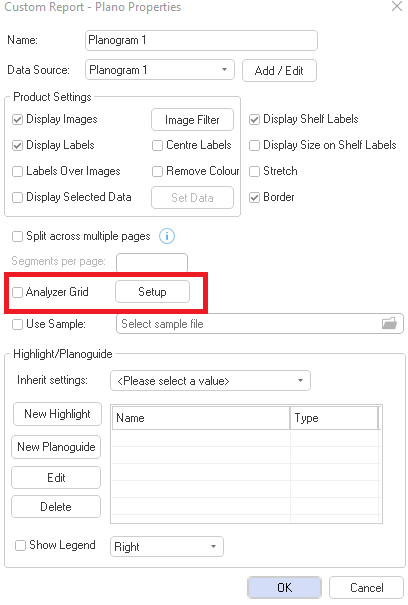
After enabling the checkbox for the ‘Analyzer Grid’ you will select the ‘Setup’ beside the ‘Analyzer Grid’ text. Here you will select the criteria fields that you want to add as KPIs.
The Setup will take place on the ‘Plano Analyzer Setup’ popup. You can add the criteria fields as indicated below.
You add the fields by double-clicking or selecting the arrow to add the fields.
After adding all the fields you can select ‘OK’.
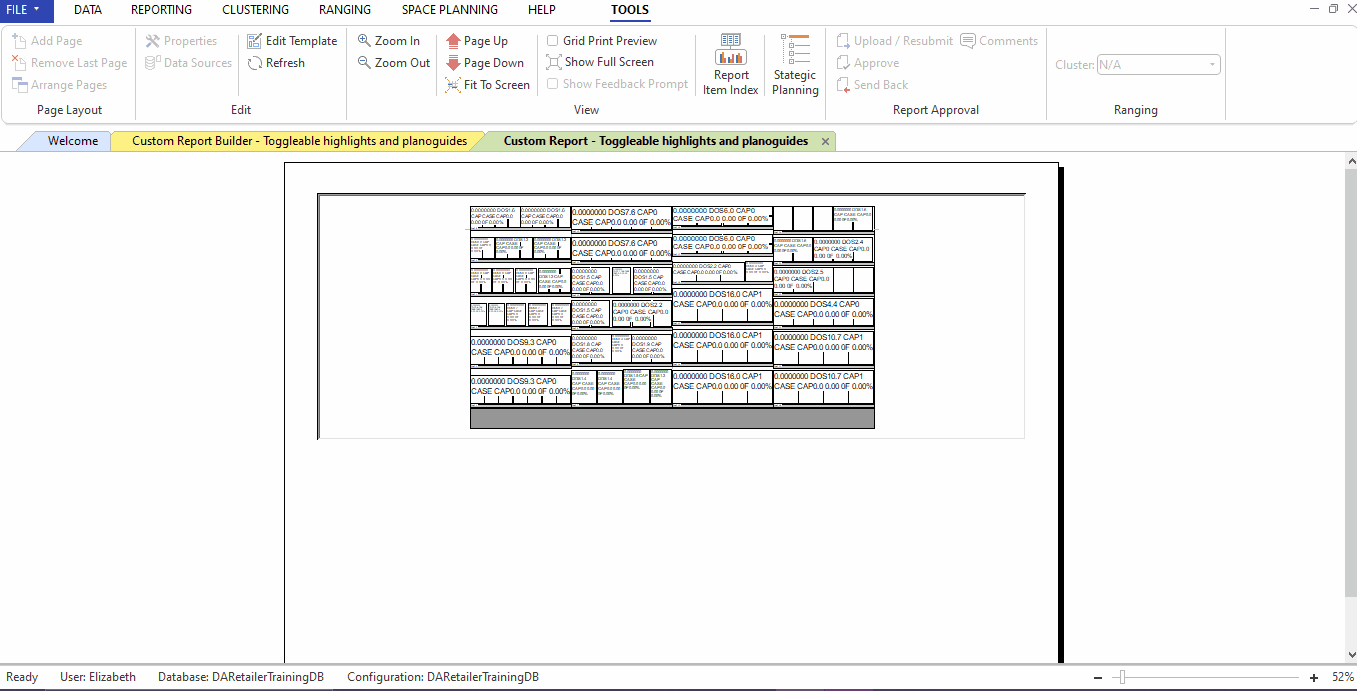
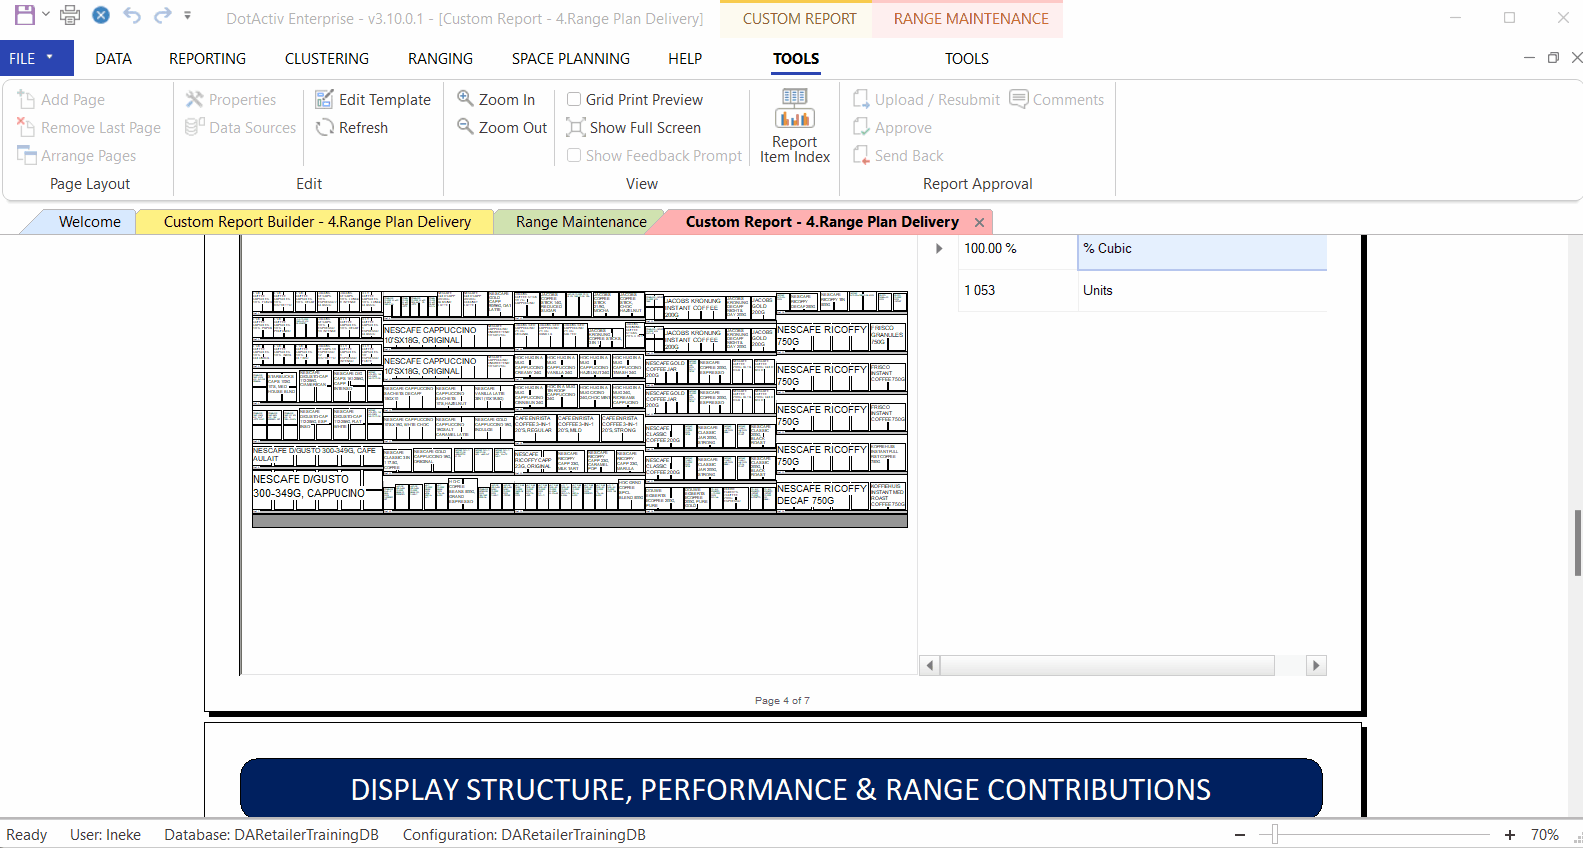
After completing the process of adding a Planogram View you can create your custom report by linking your planogram or the range plan.
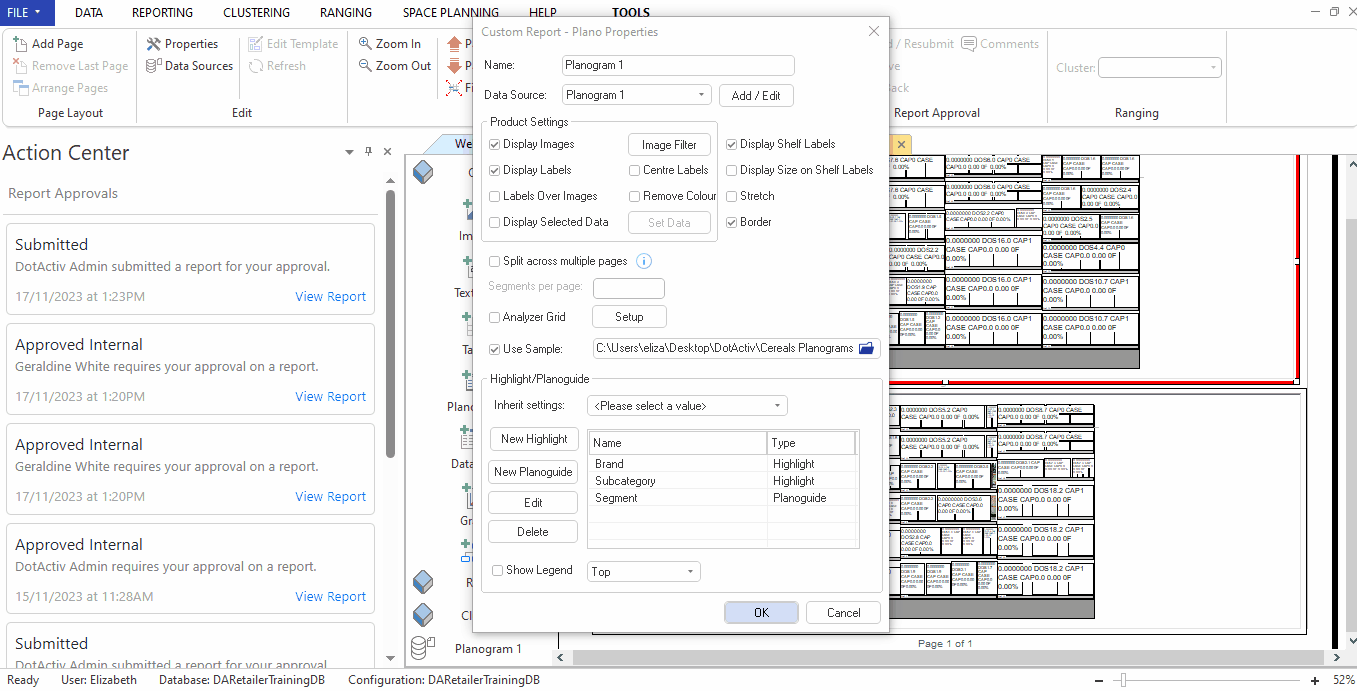
Highlights/Planoguide
When adding a planogram to a custom report, you have the option to configure any number of highlights and planoguide settings.
None of the configurations will show in builder mode but rather once the report is run. A dropdown box will be available above the item when hovering over it that you can use to toggle between the configured highlights and planoguide settings. The planogram will update accordingly.
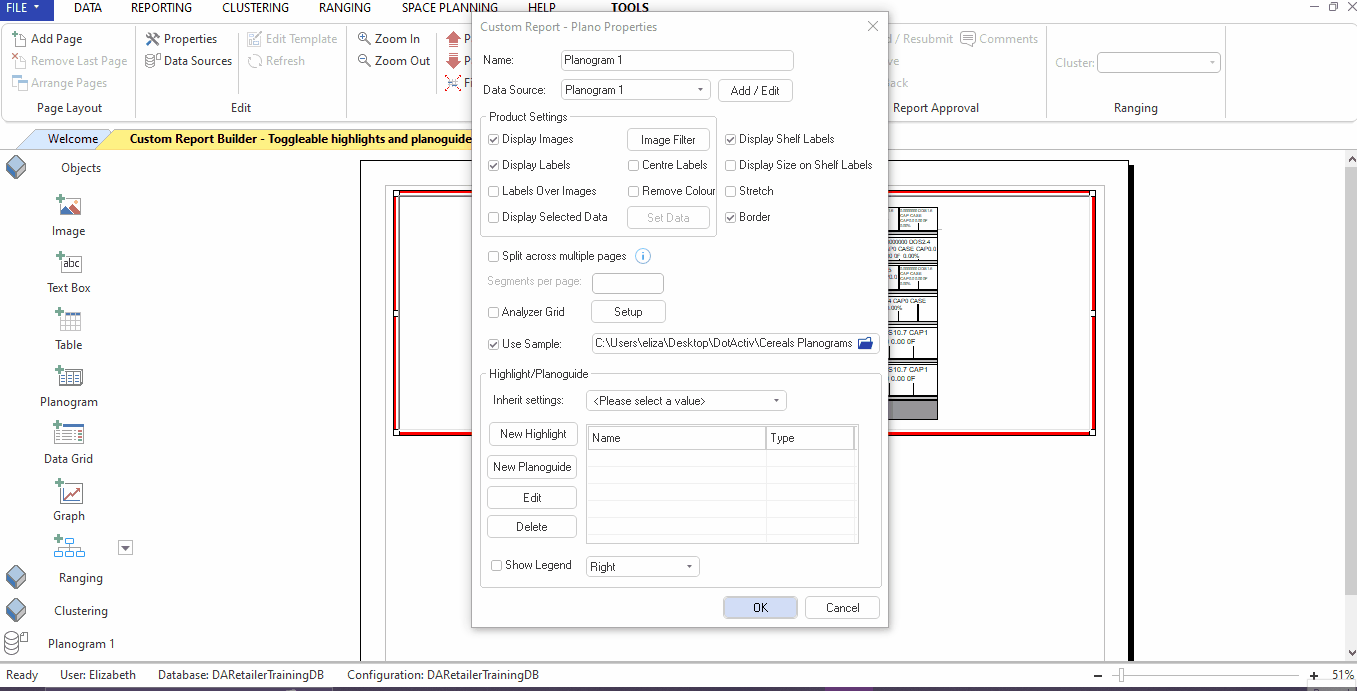
To add a new highlights configuration, click on ‘New Highlight’. Make sure you select the “Use Sample” option and link the planogram that will be used.
Select the fields that you would like to highlight and give your new highlight a name. After you click okay, the highlight config will appear in the block on the right.
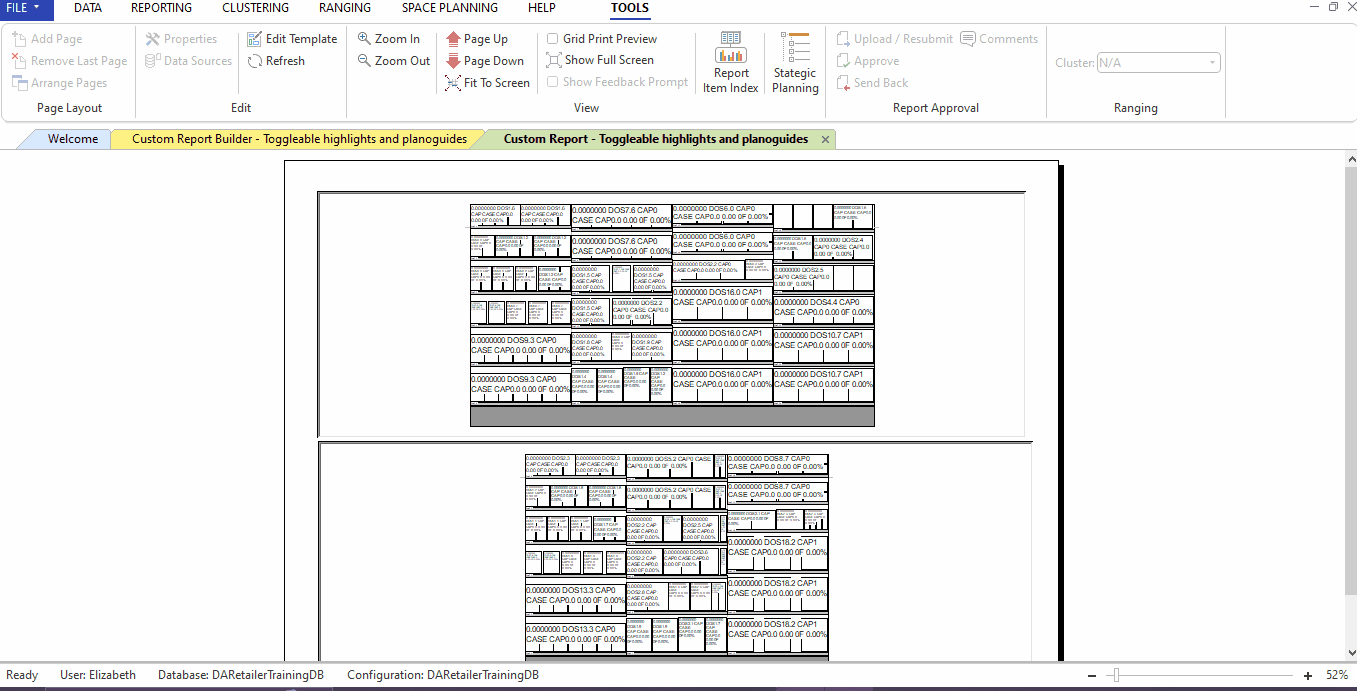
After you run the report, you will be able to toggle between the highlights that you have created.
Additionally, you can add another planogram and set it to inherit the filters of your first planogram.
To apply inherit settings, in your plano properties window select the planogram you would like to inherit from in the drop-down menu.

You will now be able to toggle between your highlights on the first planogram and have the changes reflect on the second planogram as well.

To add a planoguide configuration, in the plano properties window, click on ‘New Planoguide’ and select the field you would like to display in the drop-down menu. After you click okay, the planoguide config will appear in the block on the right.
On your run report you will be able to toggle between the highlights and the planoguide.
Inserting A Planogram View From A Range Plan Data Source
The first step will be to add the Planogram View to your Custom Report. You will have to open the Custom Report to which you want to add the Planogram View.
To add the Planogram View you will make use of the Planogram function on the right-hand tab under ‘Ranging’.
You will insert a planogram into your Custom Report.
Linking Your Planogram To Your Range Plan
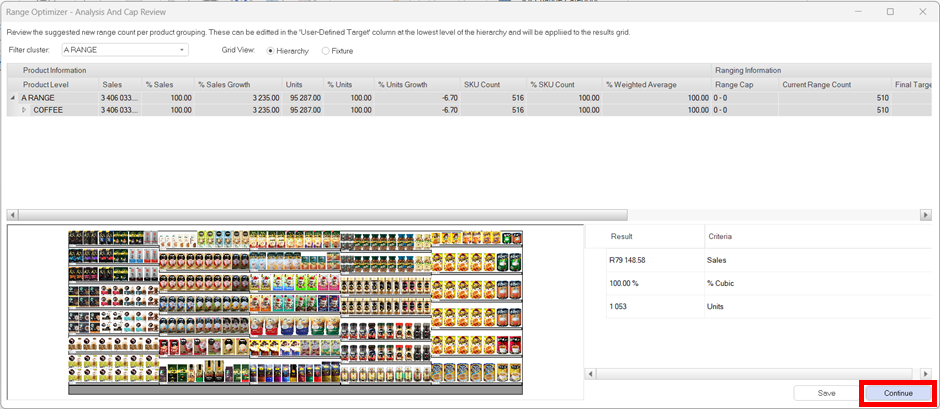
When linking a planogram to your range plan you first have to set up your range plan.
After completing the ‘Range Optimizer – Analysis and Cap Review’ you can select ‘Continue’.
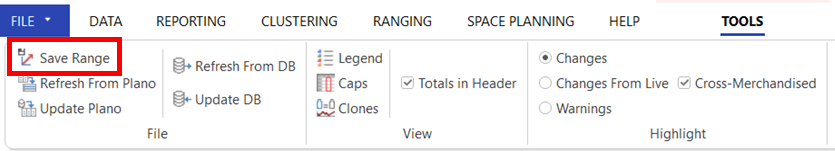
Your range will open and you can save your created or updated range.
After saving your range you can open your ‘Custom Report’ template with the Planogram View.
Now you will create the ‘Custom Report’ and link the relevant files as seen below.
When linking the range Plan you will have to link 2 planograms. The Current Planogram has to be linked to the ‘Pre Analysis Planogram’ and the Proposed Planogram has to be linked to the ‘New Planogram’.
After linking your planograms you can select ‘OK’.
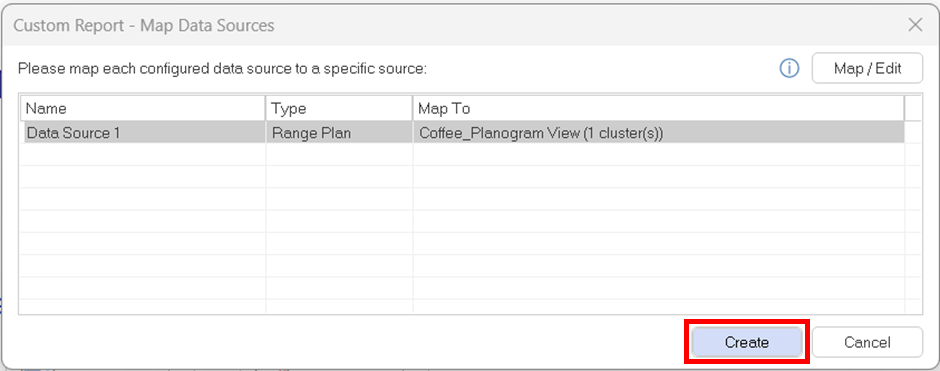
On the ‘Custom Report – Map Data Sources’ you can select ‘Create’ when you completed mapping all of your data sources.
Enable Planogram View Images
When your images are not visible on the ‘Planogram View’ you can enable them by selecting the settings button displayed in the top left corner of the ‘Planogram View’ when you hover over the ‘Planogram View’.
On the ‘Properties’ tab that will pop up, you will be able to enable the images on the ‘Planogram View’.
Changing The Analyzer Grid Fields
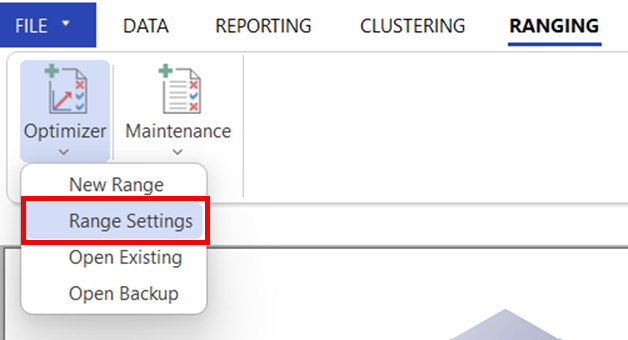
You can change the Analyzer Gird fields by editing the ‘Range Settings’ under the ‘Range Optimizer’ button.
You can field the Analyzer by selecting the drop-down button on the ‘Range Optimizer’, as indicated below.
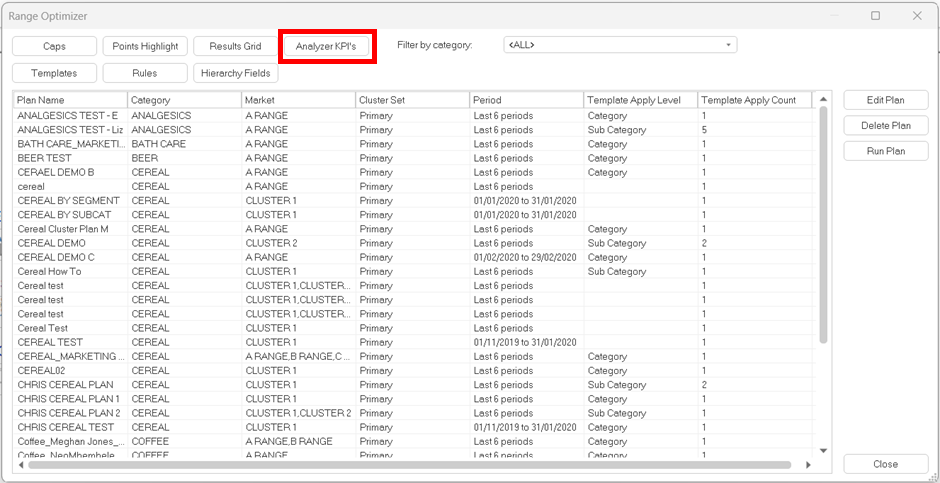
On the ‘Range Setting’ properties you can select the ‘Analyzer KPIs’ button.
On the ‘Ranging – Analyzer KPI/Field Setup’ you will be able to add extra fields to the Analyzer Grid Fields.
After updating the Analyzer Grid KPI fields you will be able to see the change by selecting the ‘refresh’ button in the ‘Tools’ tab when having your selected DR file open where you included your Planogram View.