The purpose of this article is to help guide you on how to set up and run a new range plan within the range optimizer of the DotActiv software. It will provide a step-by-step process on how to complete such a task.
When choosing the Range Optimizer tool in the ‘Ranging’ tab the drop-down menu below the ‘Optimizer’ icon provides a few options as indicated below.

Range Settings
- Use ‘New range’ when creating a new range plan from the start or when using an existing range plan settings.
- ‘Open Existing’ will be used when you open an existing range plan in the database.
- ‘Open Backup’ is when you are refreshing the information from the database to the last saved range plan.
- ‘Range Settings’ are used to set up your defaults before you start using the Range Optimizer feature. This is a once-off exercise and the range settings will be used every time you use the optimizer tool unless you update them.
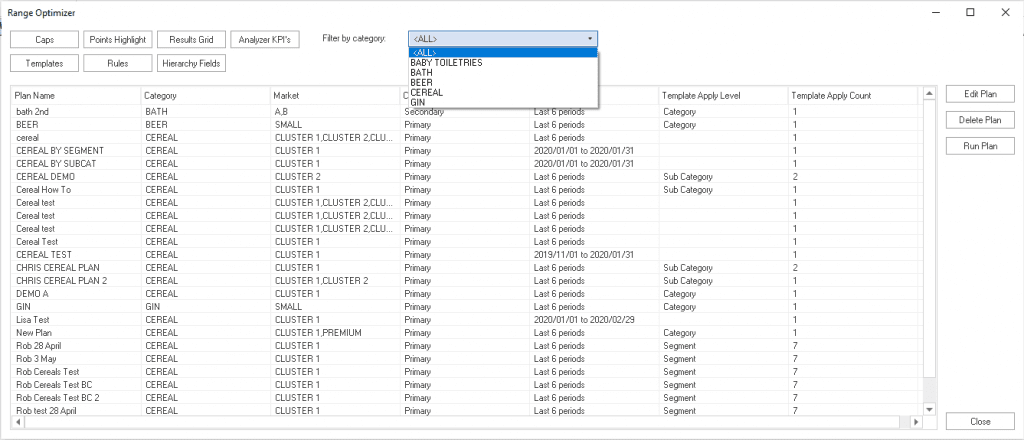
When opening Range Settings as seen above, you can filter by category when viewing the available range plans which have been set up.
You can also use the Range Settings option to run a new range or edit settings on your already existing range plans as shown in the above image instead of clicking through the wizard and changing the range plan settings.
The different settings that need to be set up are seen in the left-hand corner and will be explained below.
You can break them up into:
- Setup Caps,
- Points Highlight,
- Setup Results Grid,
- Setup Analyzer KPI’s,
- Setup Templates,
- Setup Rules, and
- Hierarchy Fields.
Setup Caps
Range caps refer to the maximum number of products that can be listed and that will fit within the space available for the category or cluster. When opening the caps section you first need to select the ‘Cluster Set’ you will be working with and then you can choose a category from the dropdown menu.
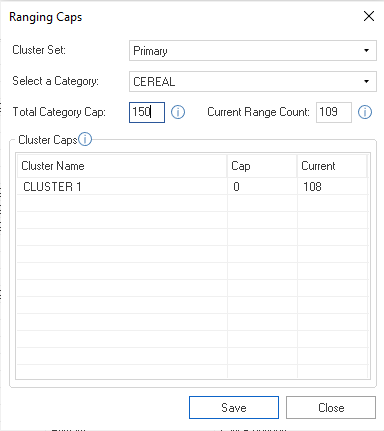
Once you have set up the caps for the category, this will be updated in the database and this will not need to be changed each time you run a range plan. You can input a total category cap for the product category. This refers to the maximum number of listings that should be available for the category across all clusters.
The current range count on the database will also appear next to the category cap for comparison purposes. The user is able to click on the ‘Cap’ per cluster on the ‘Cluster Cap’ section to input a cluster-specific range cap.
*A tip to determine your range cap:
Put all of the products on the planogram on one facing and pack everything to the left. This will be a good indication of how much space is available. If there is too much space open on the planogram, you could suggest adding more products (meaning, a higher range cap). If the available space is very congested, decrease the range cap to open up some space.
Always keep in mind that the size of the products will impact the range cap. If you have an existing planogram, use the current number of products to determine whether you can increase your range cap or if it is necessary to decrease it. If you are working on a new category, the range cap suggestion will be a lot more theoretical (research the type of products).
Points Highlight
Within this setting, the user can set the colours to reflect the points contribution according to the displayed percentage. These are fully customisable to the user.
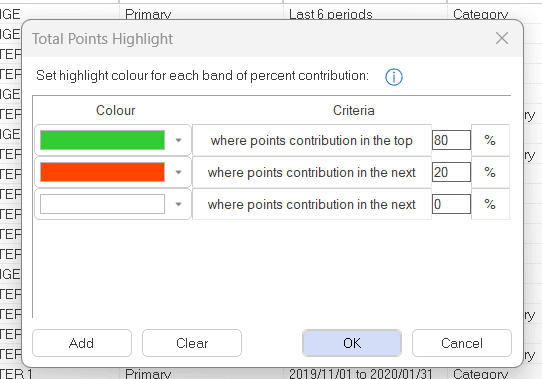
For example, if you wanted to show a Pareto Analysis, you could select the top 20% of points to green and then the next 80% of the points to red and remove the third highlight.
Setup Results Grid
This gives you the option to add fields that will be added to the summary results grid after the Range Optimizer tool has run. You can choose from any of the Product, Market or Fact fields available on your database. The fields can be displayed, updated or both.
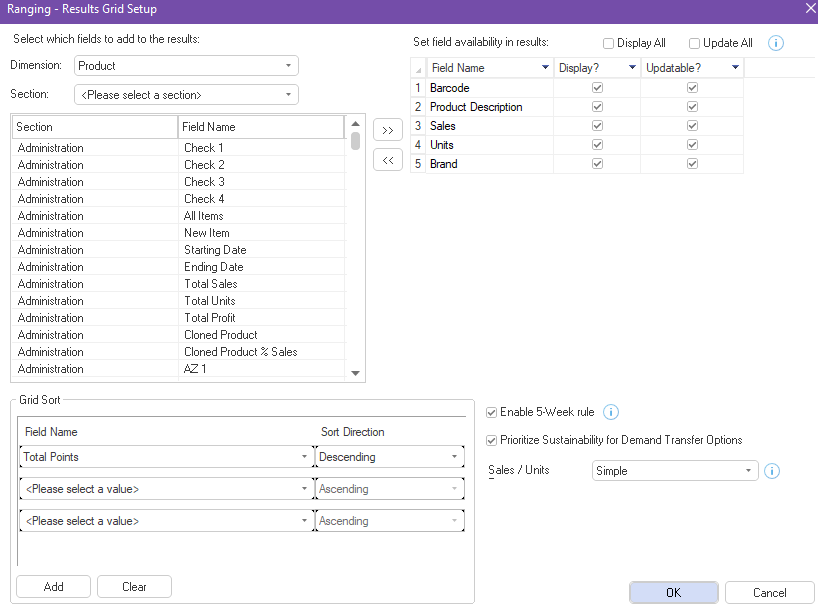
‘Display’ means that the field will be visible in the results grid while ‘Update’ means that the field will be available for selection when updating ranges to planograms. The ‘Grid Sort’ setting, allows you to change the sorting settings on the final grid.
You can also choose to select the ‘Enable 5-Week rule’ box which will flag the products that have more than 5 weeks of stock in the store on the results grid.
Underneath the ‘Enable 5-Week rule’ box you can choose to prioritise sustainability for your transfer of demand options. This toggle will slightly adjust the logic used when shortlisting options for a product’s transfer of demand. If applied, if possible, 3 of the 5 same-brand products we aim to add will be sustainable products and 3 of 5 other products best matching on description will be sustainable products.
Setup Analyzer KPI’s
When using the Range Optimizer tool, there is a host of available KPI’s to select from. They can be configured to be available at different steps in the process.
The cap review Analyzer and cap review grid are used for a range pre-analysis (before you have run the optimizer tool to produce a new range) and the planogram view Analyzer and impact analysis grid are used for a range post-analysis (after you have run the optimizer tool to produce a new range).

When ranging with the planogram analyzer the KPI’s/Fields that the user wishes to add in can be added in with this setting. If a KPI is not applicable to a certain section, then the DotActiv software will automatically exclude it.
The analyzer grid can now include sustainability which includes KPIs that correspond with Eco-Packaging and Product sustainability. The set number will be use-defined.
Setup Templates
Here you can configure or manage the templates. A template is a set of rules which are grouped together that will be applied to a specific level of the hierarchy. It is set up to define the points given to a product based on the rules in the template.

In the Range Optimizer tool, templates are not category-specific, they are now rule-specific. This means that they should be given an applicable name that reflects its rules such as profit-generating or image enhancing that will link to the category strategy that is applicable to the category role. The description of the template will automatically update to the rules included in the template.
The go green template is focused on the sustainability prioritized categories, this enables you to select a template that includes rules related to sustainability. The Go Green template can be set up by clicking the ‘Load Templates’ option selecting Go Green and then Load and then clicking Okay, as well as Close. You can then select the options from the dropdown menu and see the go green template.

Setup Rules
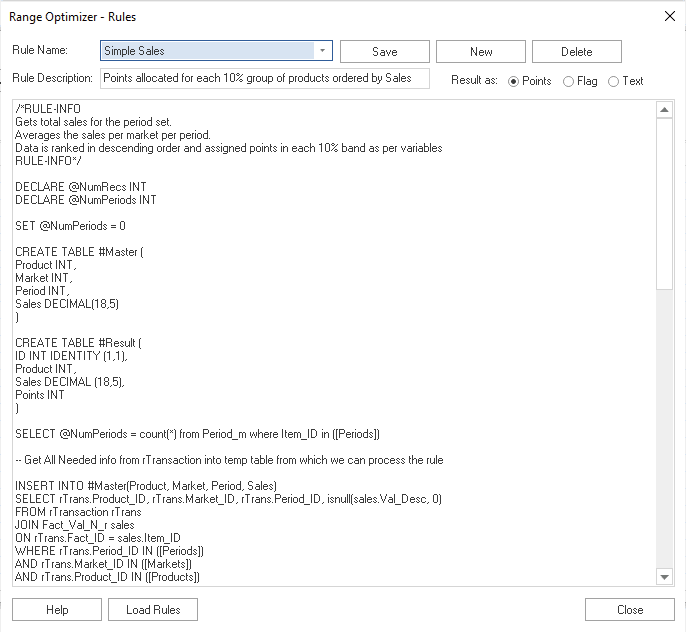
Rules are coded in SQL and describe how points are allocated to products when running the Range Optimizer tool.
Rules are pre-set-up calculations that give products a points-scoring based on the rules that are linked to them. Your products are then ranked based on specific attributes to address the needs of your customers.
The DotActiv software comes with a list of standard rules, that you can find by simply clicking on Setup Rules’ and then clicking on ‘Load Rules’ at the bottom of the window as seen in the gif below.
Basic rules include Sales and Units, Time on Shelf, Good Better Best, SKU Size Limiter and many others. If you have a specific rule that influences the weighting of your SKU’s then custom rules can be created for you based on specific scenarios.
This function also allows you to view each rule and allows you to set how they will be reflected as either points, a flag, or text. Select the rule you would like to view from the drop-down menu next to ‘Rule Name’, as seen below. For this example, we selected the ‘Simple Sales’ rule.
You can now also add Simple / Weighted or Numeric Distribution (ND) rules. Select ‘New’ to create a new rule, next provide a ‘Rule Name’ and then select the rules to include which are Simple Sales, Sales Weighted, Sales (ND), Simple Units, Units Weighted and Units (ND), as seen below. For this example, we selected the name ‘SALES AND UNITS’. Click on Save and then Close.

Should you require a rule that is not available on the database, please contact our IT Support Team to set this up for you.
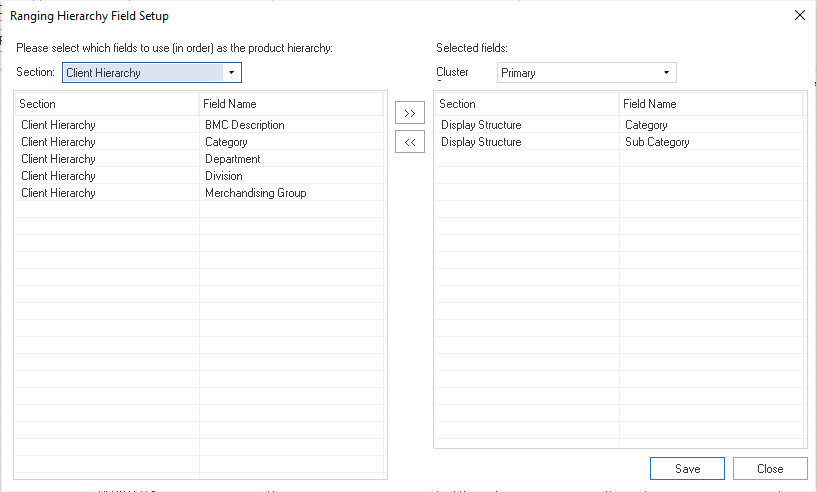
Hierarchy Fields
Here the user selects which display hierarchy fields will be available for analysis. You can choose if you’d like to work with the primary or secondary ‘Cluster Set’ on the right-hand side of the window.
If some categories and departments differ, you can always go back to the range settings and update this field.
Creating A New Range Plan
Step 1 – New Range
Locate the ‘New range’ button under the Range Optimizer feature in the ‘Ranging’ tab as seen above. The Range Optimizer tool uses a wizard setup that guides you through the process. You can see which step of the process you are currently on and you can click next to move to the next step.
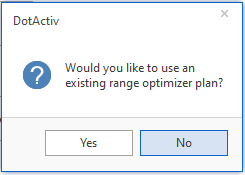
Step 2 – New vs Existing
When clicking on ‘New Range’, choose whether you would like to use an existing range optimization setup by clicking on ‘Yes’. If you do not want to use an existing range optimizer plan, click on ‘No’, as seen in the image below.
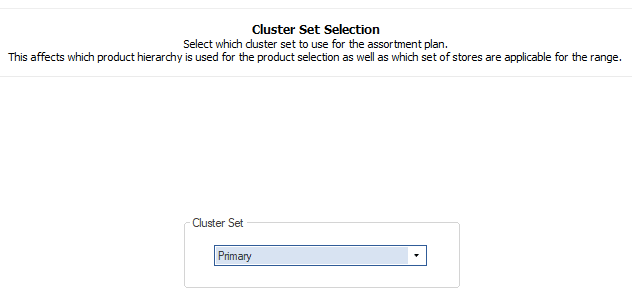
Step 3 – Cluster Set Selection
Select the ‘Cluster Set’ you would like to use for the assortment plan from the dropdown menu.
Step 4 – Category Selection
Select the ‘Category’ you would like to range. Select a category from the dropdown menu. All available categories on your database will be available for selection here.

If you are a DotActiv employee, you will need to follow the assortment planning process when working with the Range Optimizer tool. Before you select the category you would like to work with, you will need to conduct a ranging performance objectives consultation with the buyer and/or their manager.
Please note that this is important because this process will confirm the ranging inputs they would like to work with based on the goals of their business and the results of the clustering exercise (if one was conducted).
If you are a DotActiv client or staff member, you will need to ensure that cluster maintenance has been set up first before using the Range Optimizer tool.
Step 5 – Points Highlight Setup
Review the highlights you set in your range settings.
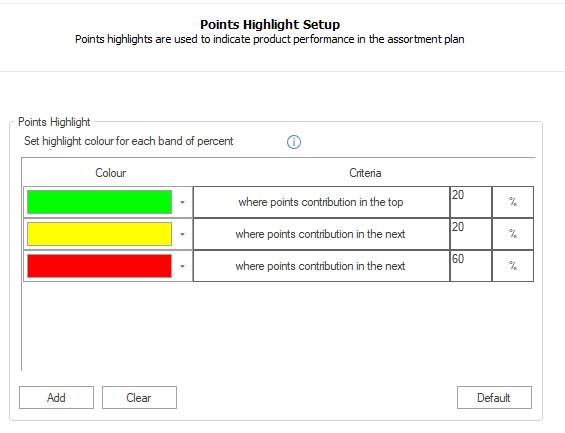
In this step, you can review the highlights to assist you in the decision-making process. This is a helpful tool when you want to see the top, moderate and bottom-performing products or if you wish for it to be shown in a Pareto analysis view.
You can add and remove fields by using the ‘Add’ and ‘Clear’ buttons and the bottom. If you want to go back to the default highlights, click ‘Default’
Step 6 – Product Filtering
Next is applying product filters.
This is used if you wish to further limit which products you want to use in this exercise for example active or inactive products. This is not a necessary step but can be useful when looking at specific products.

You are also able to specify that the software automatically includes inactive products with the POG indicator on. This means that the product should be on the current planogram. The user is also able to specify product ID values that should always be included in the range. This may be particularly helpful when working with cross-merchandised products.
Step 7 – Product Inclusion
First, ensure that you have added ‘Cross Merchandised Categories’ in your DotActiv SQL view.
Thereafter within the ‘Range Optimizer’ wizard, you are able to specify which cross-merchandised products the software automatically needs to include. The user is also able to add additional products by specifying the product ID or product description, as seen in the gif below:

Step 8 – Template View
View and edit the templates you wish to work with.

A list of the available templates on the database will appear in the box under ‘Available Templates’.
To edit the templates, click on ‘Configure’ and select rules from the list that are available on your database. Once you are happy with the templates you can click next.
Step 9 – Plan Setup
Apply templates to the desired level of the display hierarchy.

Before applying templates there are settings that you can set up to simplify your hierarchy view. These settings include ‘Hierarchy Order’ and ‘Subtotal Results’. Each one will be explained below.
- Hierarchy Order: This shows the display hierarchy you are working with (e.g. segment would be left out if the client does not include this level in their display hierarchy). This is set up in your range settings before you start the ranging exercise. You can tick or untick certain levels based on what you want to view at this stage. Unticking a certain level will not remove this information from your ranging exercise.

- Subtotal Results: This details what level of the hierarchy you would like to see performance data and range caps for in the next steps of the wizard. E.g. This means you will be able to see all performance data, KPI’s and range caps at a brand level if that’s what you select.

Applying Templates: To apply the templates you can simply drag the desired template to the level of the hierarchy. The level chosen by the user will be shown at the top, next to the ‘Apply Level’ field, as seen in the gif below.
If you wish to use the same template for all Subcategories and Brands, simply drag the template to the Category. If you wish to split it by Sub Category or Brand you can drag each template to the desired level as the example above shows.
Although it is best practice to allocate a template to all levels of the hierarchy, you are able to choose not to apply a template if you only want to complete ranging for a certain section of the hierarchy (e.g. a certain brand or subcategory). This means that no points will be allocated to the excluded section and no range changes will be recommended by the optimizer tool.
If you are working with a complex hierarchy, click full screen to view the entire hierarchy configuration. It is also possible to export it by right-clicking on the grid next to Category for reporting purposes.
Once a template has been applied at a level of the hierarchy it will change to green and the items in the hierarchy (at the configured level) that have not been allocated a template, will be red.
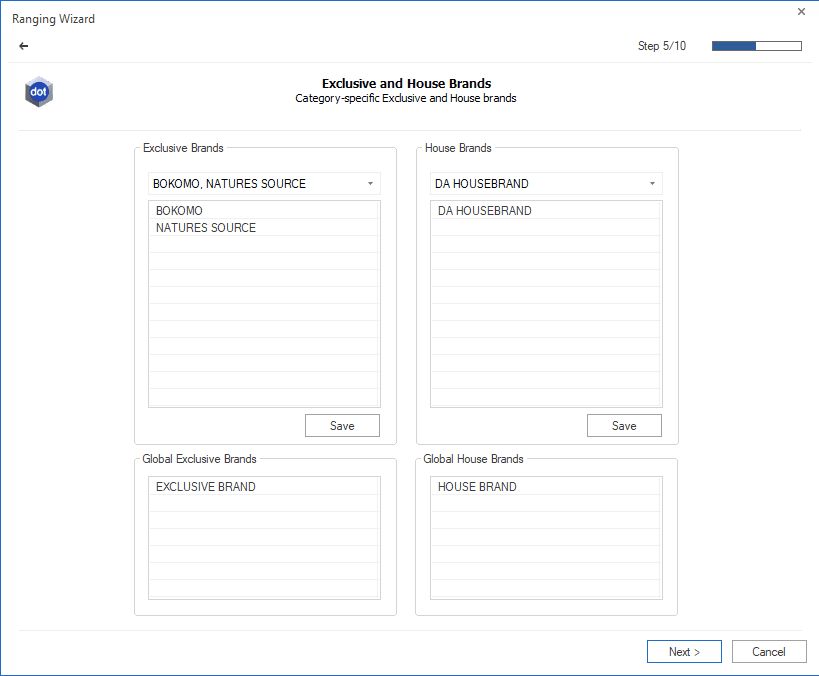
Step 10 – Exclusive And House Brands
Here you will be able to configure exclusive brands and house brands that are specific to the range from the drop-down menu on the top of the window. The global exclusive brands and house brands will be listed at the bottom of the window. These are taken into consideration for the respective brand ranging rules.
Step 11 – Market Selection
Now you can select clusters and any additional market filters.
First select which already set up clusters you wish to work with by ticking the applicable clusters on the drop-down menu. You can work with multiple at a time or one at a time.
You also have the option of selecting a saved cluster plan instead of a live cluster plan. This might prove useful if you would like to run the range without having to implement it yet.

Under ‘Market Filter’, you can further filter on any additional values to define your range. For example, region and store size and other available market fields on the database.
Step 12 – Market Comparisons (Optional)
If relevant, pick market comparisons.
This step allows you to pick market data to pull for comparison on the final results grid. This is an optional step.

The user also has the option to add external market data into the range analysis that can be used for comparisons or identification of opportunity gaps. This data would need to be given to our IT Support Team to be incorporated into the database.
Step 13 – Period Selection
Pick your period of data as specified in your first consultation if you are a DotActiv employee or any time period you wish to use if you are a DotActiv client.

It is recommended to use a sufficient time period (e.g. 6 months to a year) if possible and also consider seasonality here. E.g. If you are ranging for back to school in 2020, you will use December – January 2020 data.
Step 14 – Plan Summary
Review the ‘Plan Summary’ to ensure all data is correct.

If all is in order, press ‘Save Plan’ with a name of your choosing such as the category name and press ‘Finish’. This will give you the option to open the wizard with the range settings populated when you refresh the category.
Step 15 – Run Setup
You will be redirected to the ‘Run Setup’ page where you can set which planogram and specified target metrics to use per cluster in order to estimate and evaluate range count changes when you run the setup.
The fields that are white indicate where you can change values that will change your result at the end.
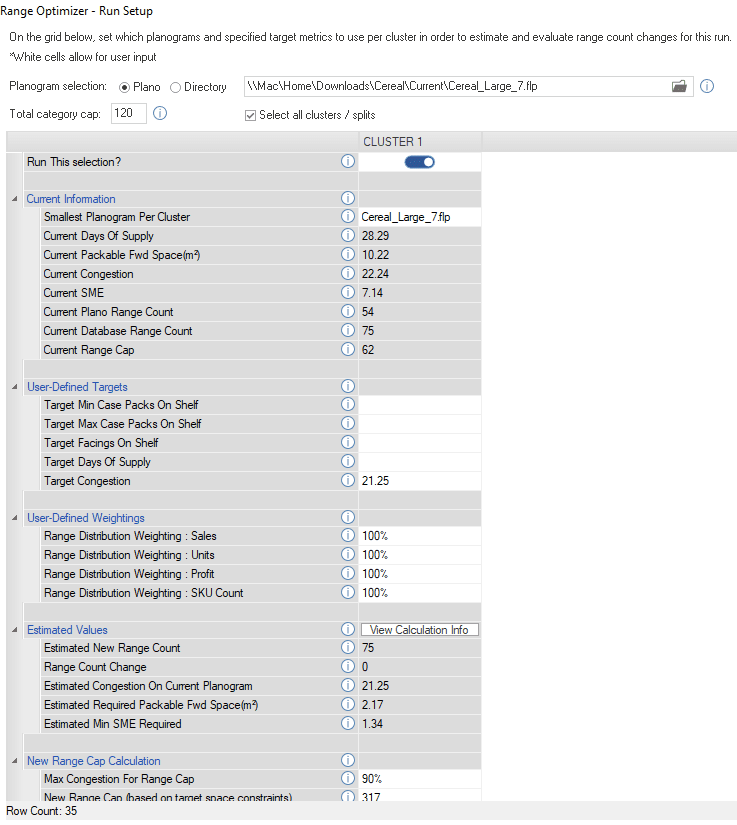
You can select a planogram from a file on your computer or from a directory that finds the smallest planogram according to the naming convention applied.

When looking at the specified target metrics you can change the white fields with data you either received from a client or how you wish for your cluster to be ranged. Your estimated new range count will change depending on what measures you put in place. If you hover over the measures on the left it will give you an explanation about the measure and what it affects.
You can also view a breakdown of the calculations by cluster by clicking on ‘View Calculation Info’. Doing so will open the ‘Calculation Detail’ window for the specific cluster that you have selected, as seen below.
Step 16 – Analysis And Cap Review
Once done, you will be redirected to the ‘Analysis and Cap’ review page where you can complete a range pre-analysis.
This is a good point to assess your current planogram performance for the selected range by clicking on the dropdown to select the cluster you would like to view. A range pre-analysis involves assessing areas for improvement and areas that are performing well in terms of your display hierarchy and fixtures.
The grid allows you to assess performance and KPI data at each level of the hierarchy as well as view range caps for these levels. You can also click on the fixture radio button to assess performance for each segment or shelf.
To view the performance data for a particular level of the hierarchy or fixture, you can also click on the applicable area in the grid. For example, click on the cold cereal subcategory and the products that are not in this subcategory will be greyed out on the planogram.

The information in the ‘Analyzer’ next to the planogram will also update to reflect the area you are currently investigating.
Once happy, click ‘Save’ or ‘Continue’. If you click on ‘Continue’, the main results grid will open.
However, you can also save at this stage if you would like to continue with your pre-analysis at a different time. This will allow you to go back and make further changes if needed.
Please note that when returning to this saved range, it will only allow you to open the ‘Analysis And Cap Review’ window as you would need to complete your analysis first before continuing to the main results grid.
Running The Range Optimizer
Once done with the ‘Pre-Analysis Review’, press ‘OK’ at the bottom of the page. This will redirect you to your range summary view.
This will run the optimizer tool. If you are delisting certain products, you might see a screen like the one below.
If you have ticked the ‘Enable 5-Week rule’ box, products that indicate the 5-week rule will be highlighted in orange as seen in the screenshot above.
This applies to products that have the POG and Supply indicators ticked, meaning that the products are currently being supplied to the store/ cluster and should be located on the planogram. Due to the range plan you have set up, the system may recommend that these products be removed from the range.
If you have enabled the 5-week rule on the results grid setup, the products that have more than 5 weeks of stock in the store, will be flagged in orange. You need to consider what to do with these products as extra stock will need to be reassigned to a new store, moved to exit stock, uplifted by suppliers or marked down (i.e. stores need to be told what to do with the stock if it is going to be removed from the planogram).
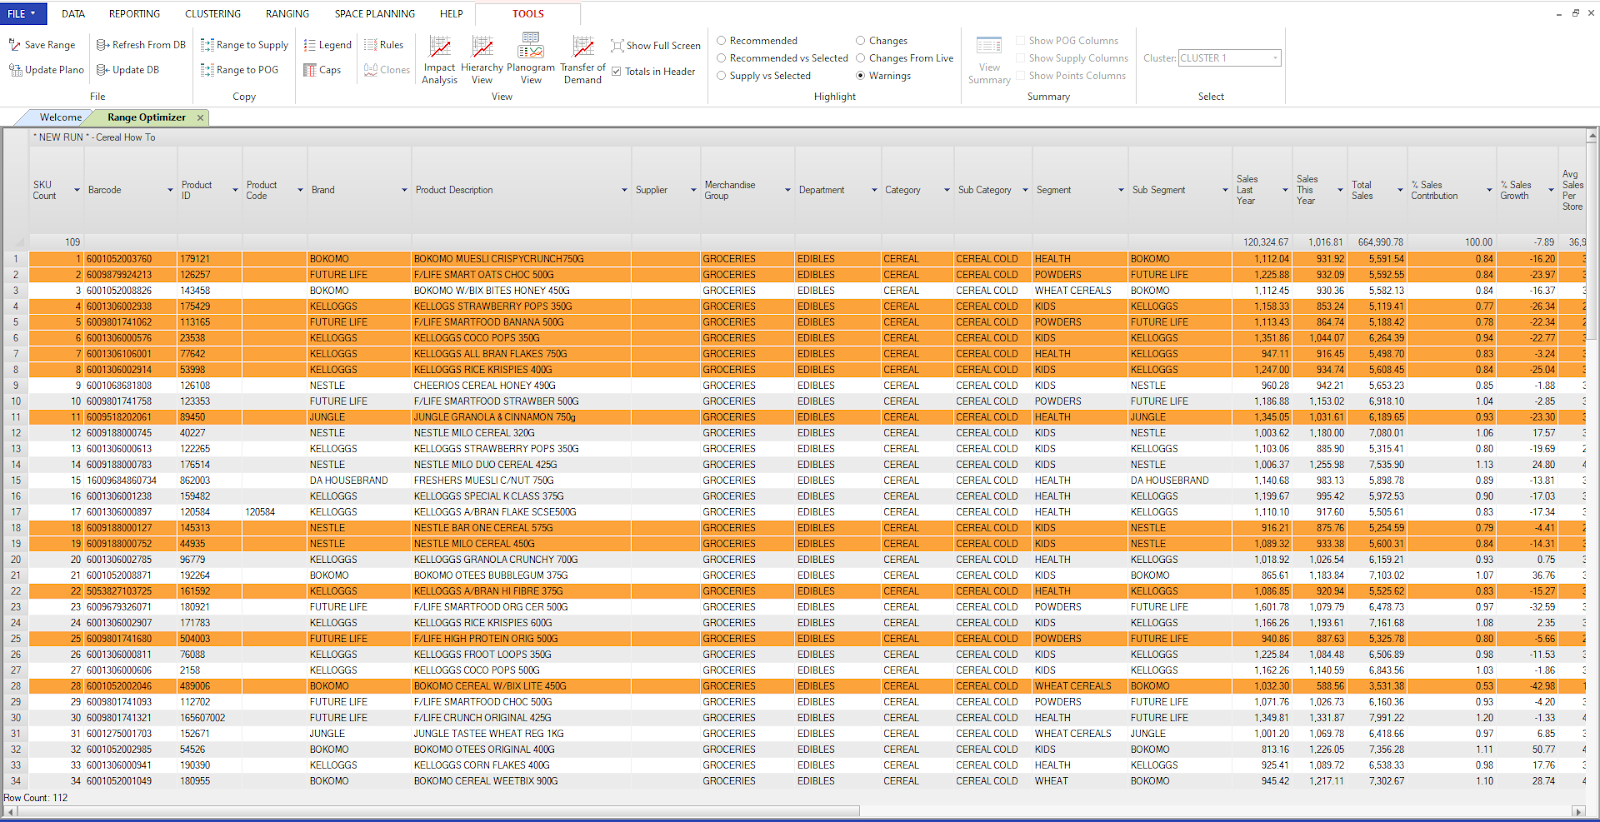
The fields available in the grid below were selected when you completed your range settings.
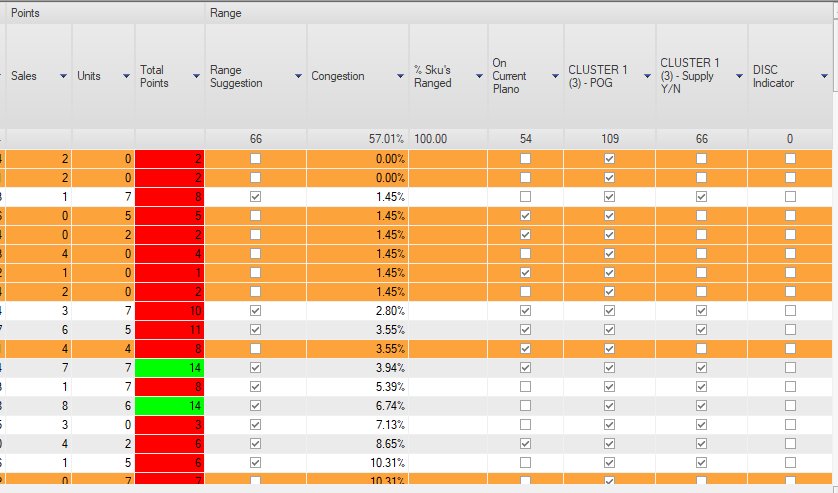
The range suggestion column shows which products are recommended to be included in the range. The POG indicator shows that the product should be located on the planogram and the Supply Y/N(Yes or No) means that the product is currently being supplied to stores by the distribution centre. The DISC(Discontinue) indicator will be ticked if the product has been discontinued.
Reporting Options
With the Range Optimizer tool, you can now make range decisions on both the summary grid by ticking and unticking the POG indicator or on the planogram view.
You also have reporting options that appear in the toolbar at the top of your screen such as the hierarchy view, impact analysis and transfer of demand report.

Planogram View
This section shows a planogram or planoguide view of the range. Tick the ‘Show images’ box if you wish to work with the images.

In this view, you are able to change your range by working on the planogram. You can drag rows from the range and drop them on any shelf to add to the planogram or you can drag items to the red shelf that you wish to remove from the range.
This view is updatable with the summary grid by clicking the ‘Apply Grid Range’ button in the top bar. You can also view the planogram as a planoguide if necessary.
If you would like to see where products have been delisted and where there is now space available on the planogram, you can right-click on a product and click delist and turn your images off to see the products reflect in red.
If you change the facings by clicking on a product and then a number on your keyboard, these products will reflect in orange. If you add products to the planogram, these products will appear in green.
Hierarchy View
The hierarchy view shows the impact of the range changes you have made within the context of the whole product category.
- Levels of the hierarchy that are over ranged appear in red.
- Levels of the hierarchy that fit within the range cap appear in green.
- Levels of the hierarchy that are under ranged appear in yellow.

You also have the option to toggle between the ‘Chart’, as seen in the screenshot above, and ‘Grid’ views.
Impact Analysis
This is a grid showing the impact of the proposed range changes drilled down to the brand level relating to the KPI’s you selected in your range settings.

Transfer Of Demand Report
This report details what will happen to the sales of the products being delisted. A portion of the sales that were attributed to the delisted products will be transferred over to the products that remain in the range. The delisted products are detailed in terms of their performance, levels of the hierarchy, and brand profile.
This information is used to find the top-performing or best substitute to which the sales will be transferred. A substitute will be provided for each delisted product.

You can click on the product description to see the top ten options based on the brand and the product description and select a replacement if you would like an alternative.
Please note that for each delisted product, up to 5 options are provided which consist of ranged products from the same hierarchy group (Sub Cat, maybe Segment and Subsegment) and from the same brand ranked by sales and then another 5 products based on the product description.
Transfer of demand is typically worked out based on the brand profile. If products fit the same brand profile then an estimated 100% of the sales will be transferred.
If the products fit slightly different brand profiles (e.g. economy to mid-tier or mid-tier to premium) an estimated 75% of the sales will be transferred to the product(s) remaining in the range.
If the product fits completely different brand profiles (e.g. economy to premium) then an estimated 50% of the sales will be transferred.
Brand Profiling
It is important to profile a brand. This means that you assign a tier to a brand, for example, a brand can be an economy brand, a mid-tier or a premium.
Brands are profiled automatically in the DotActiv software according to average retail price using equivalised volume. To profile brands according to an average price is the best way to profile brands, however, it is still important to confirm the profiles as brand image plays a big role with some brands. A product may have a low average price but in a consumer’s mind, it may be more of a premium product to brand image.
Sustainability also affects brand profiles. A mid-tier product with Eco-Packaging could be considered a premium product to a consumer due to the use of eco-friendly packaging. So, sustainability is another factor in profiling brands.
Brand profiling is a scheduled task on the database that runs in the back end. If you would like to reprofile some brands due to brand image this function in the software allows for a quick setup change.

You will be able to set or add brand profile overrides per product category.
If you would like to view all the brand profiles you have set up, you can navigate to ‘File’, then click on ‘Setup’ and lastly select ‘Brand Profiles’ and ‘View All’ to view the brand profiles for all categories.
Range Optimizer is used to optimise a range based on certain variables or rules. The Range Optimizer tool applies rules to a range and the DotActiv software can apply logic to suggest a range. This function is also used when creating a new range.
On the other hand, range maintenance holds the current range and allows you to run basic ranges that have no rules. This allows the user to choose the range created in the range optimizer tool or to run the data from where the database is maintained.
Should the above steps not work for you, please create a support ticket and the DotActiv support team will assist you in uncovering the issue.