The purpose of this article is to provide a high-level view of the different reporting options available in Floor Planning.
Pre-Checks
Before you start with Floor Plan reporting, please ensure that the below points are correct.
- Make sure that all naming conventions are exactly the same to the last letter. Any reporting, importing or pulling of data is very sensitive to this. The slightest change to the name of either the planogram, category on the floorplan or in the classifications could cause that data does not pull through properly. Also, check for any spacing between letters or words.
- The ID or Key detail in your floorplan needs to be populated. The ID or Key detail will be found when you double click on the floorplan, the ‘Floor Properties’ window will pop-up, under ‘Store Detail’ you will find your ID or Key field as seen in the snippet below. In this particular case, the retailers’ ID or Key detail is identified as the ID Store.
Please note that the ID or Key detail is used when importing data, because each store is unique and has its own data and therefore an ID or Key is given to each store.

For reporting, navigate to the top ribbon and click on the ‘Reporting’ tab. There you will find the different reporting options in the Floor Plan section, namely:
- Floor Report
- Floor Performance
- Store Fixtures
- Changes
Floor Report
The Floor Report has two options to choose from, namely a Gondola Report and a Floor and Gondola Report. As seen in the drop-down menu in the image below when you hover your cursor over the ‘Floor Report’ icon.

Gondola Report
The Gondola Report gives you a high-level summary of what consists within each Gondola on the floor, including, naming, measurements, how much space is left in the Gondola, SKU count without the floorplan attached. Please see an example of this report in the image below.

Once you have completed and printed your report to PDF, the end result looks like the image below.

Floor and Gondola Report
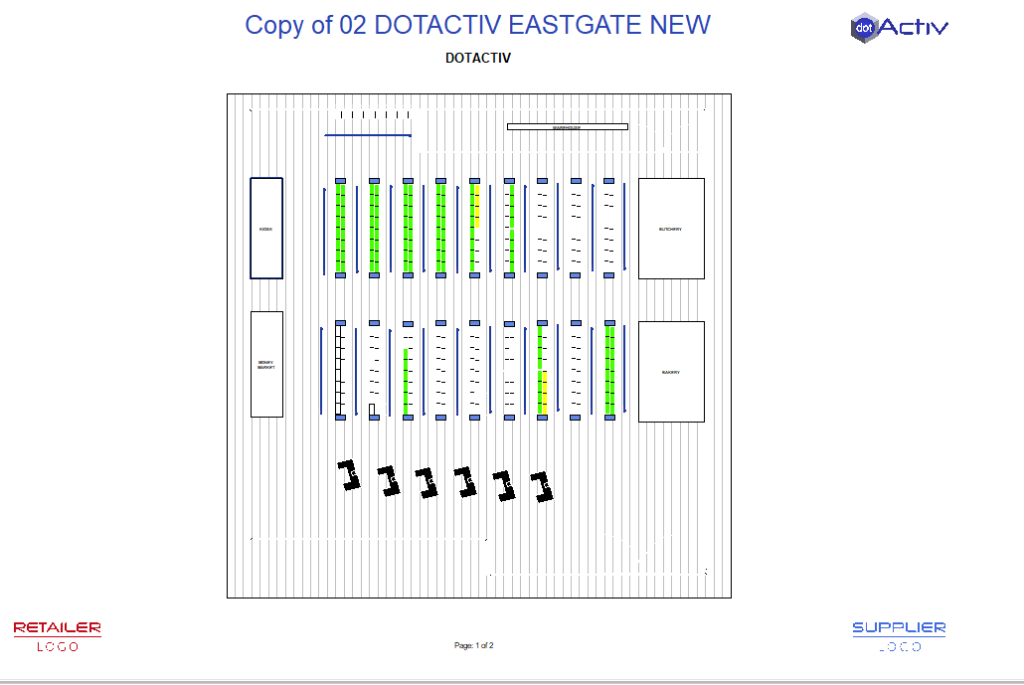
Secondly, a Floor and Gondola Report gives you the same report as above but this report includes the floorplan in the PDF. An example has been included below.
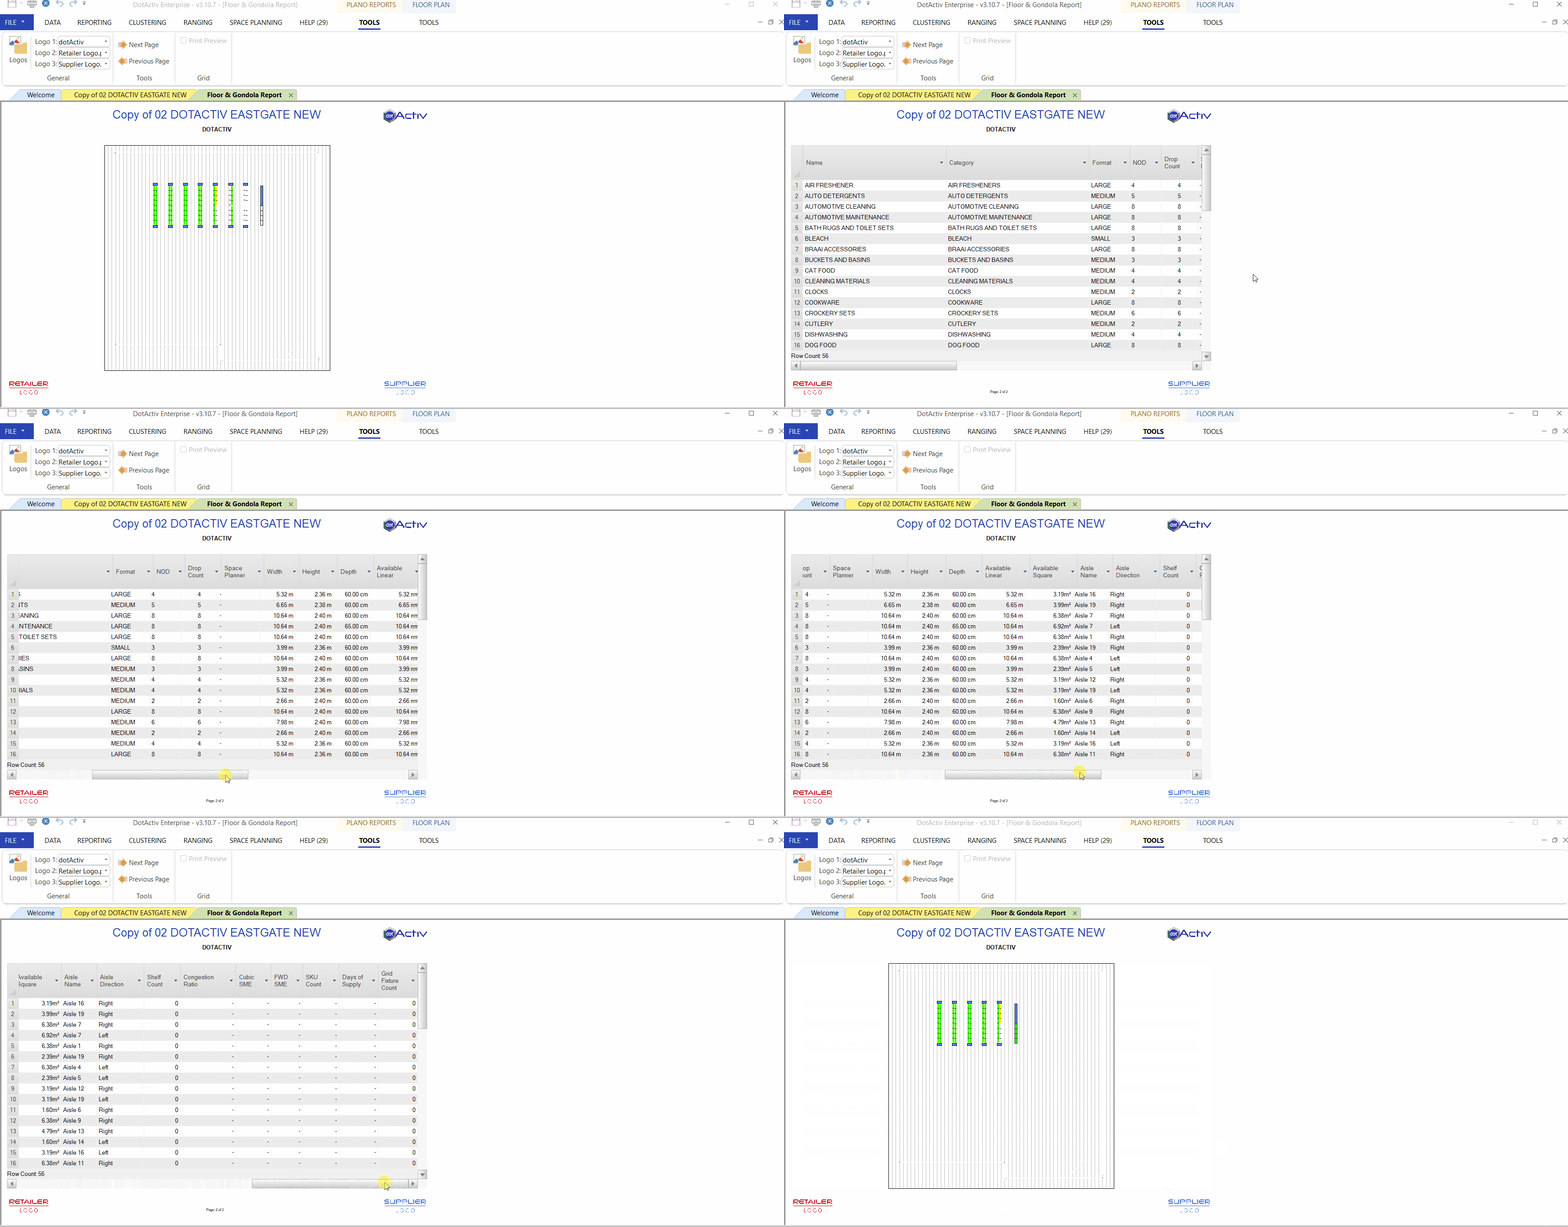
Below is an example of a printed Floor and Gondola report. The floor plan is displayed on the first page.
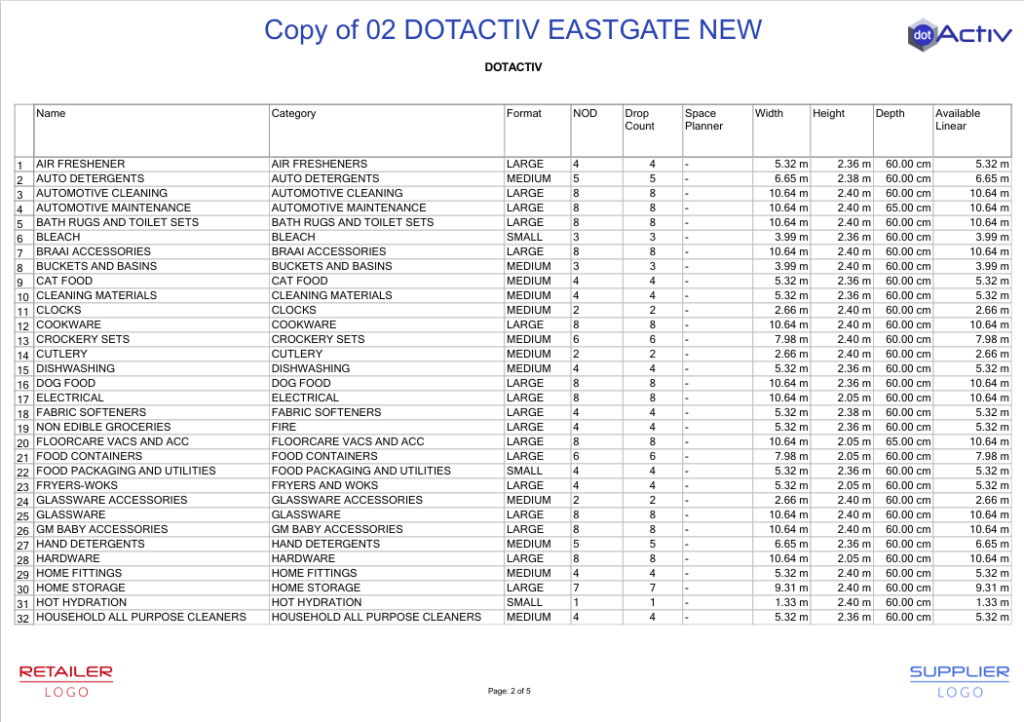
You will find the data on the second page, see below image.
Floor Performance Report
This report shows the performance of categories or departments across the floor i.e where the hotspots are and where the cold spots are. Hotspots refer to items that move fast and have the most traffic. Cold spots refer to the lower-performing products and where there is the least traffic.
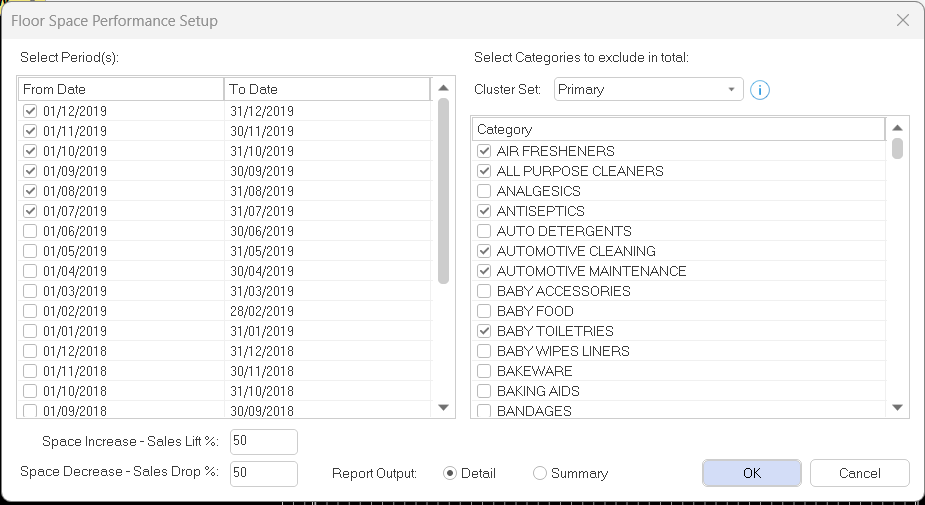
In the ‘Floor Space Performance Setup’ window, you can choose the period or periods that you would like to work with as well as the categories that you would like to exclude from the total. You also have the option to draw a detailed report or summarized version. Once this is done, you can click on ‘OK’.
You can see an example of the ‘Floor Space Performance Setup’ window in the image below.
In the ‘Map Planograms For Comparison’ window seen below, you can import new planograms to compare with the planograms that are currently in the floorplan to see whether or not a change in merchandising would be beneficial. Once you have chosen and mapped the planograms that you want to compare, select ‘OK’.

Store Fixtures Report
For this report, you will need to ensure that all your fields for fixturing are classified correctly in the database.
The Store Fixtures report gives you a summary of the fixtures itself within that specific store. You will see in the image on the left that you have the option of selecting a specific store or selecting all stores. Once you have selected the specific or all stores, you can click on ‘OK’.
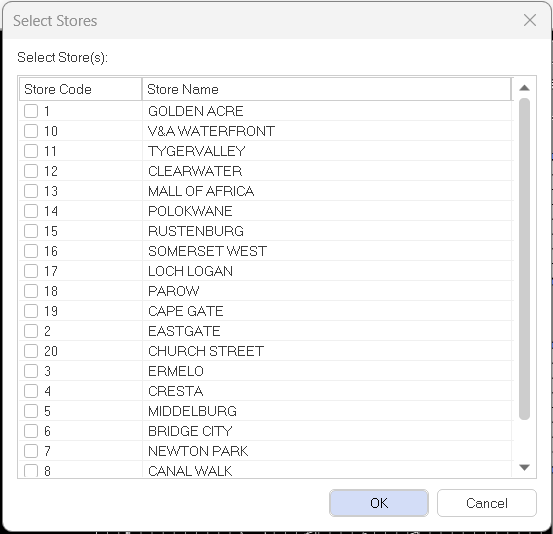
It will then generate a report which will give you a summary of each different type of fixture in that store (or all stores) and whether or not there is space sold on that fixture but shelf/peg or gondola i.e perhaps permanent space has been sold to BIC for any new product launches or seasonal products.
Once you have printed the report, the data will be displayed as seen in the image below.

Changes Report
To create the Changes Report, open the DotActiv software and navigate to the ‘Reporting’ tab. Here, under the ‘Floor Plan’ section, you can select ‘Changes’ to start creating the ‘Changes Report’.
Doing so opens the ‘Map Planogram For Comparison’ window as seen below.
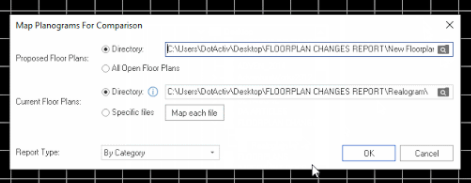
The ‘Proposed Floor Plans’ would be the new floor plan created. On the other hand, the ‘Current Floor Plans’ refer to the current floor plan in store (or the “old” floor plan).
You now have the option to either choose the files from a directory or to use open floor plans to create the report.
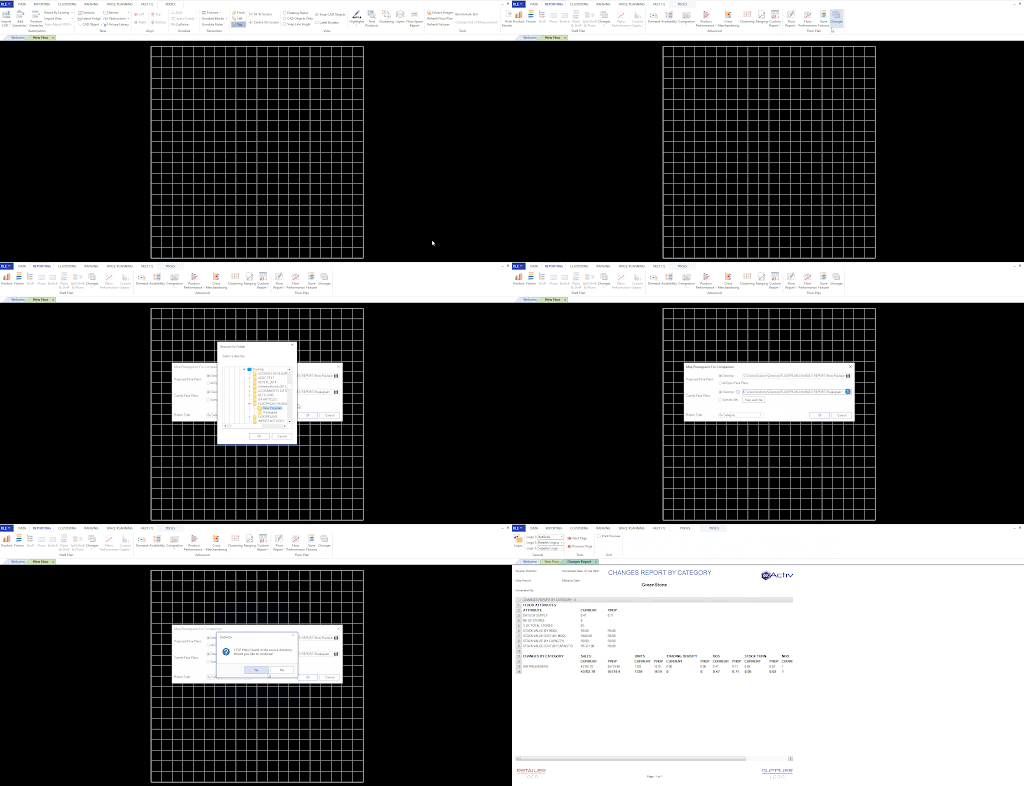
Should you wish to create reports for multiple floor plans, simply select the ‘Specific Files’ option for ‘Current Floor Plans’.
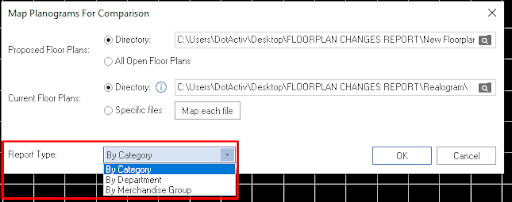
Next, choose the type of ‘Changes Report’ that you want to see.
The ‘Changes Report’ will appear in a separate tab in the DotActiv software. Here, you can change the logo’s on the report and print or PDF the report.

If the above steps do not work for you, please contact our Support Team who is always willing to help.
