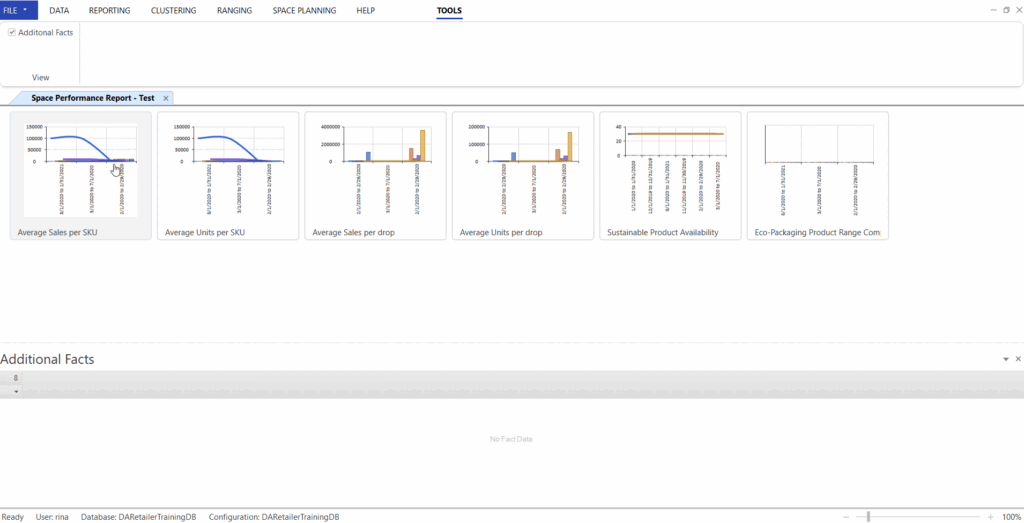
A space performance report is a reporting module that you can use to create configurations of period comparisons for a selection of departments, categories, and stores.
The space performance report displays as drillable graphs where your chosen KPIs are compared to one another. Each category has a target set per KPI and is linked to the period in which it is updated. The targets appear on the graphs as a line so that you can monitor the ‘actual’ vs. ‘targets’ over time.
A Step-By-Step Guide To Setting up A Space Performance Report
Step 1: Set Up Your Space Performance Reporting KPI Targets
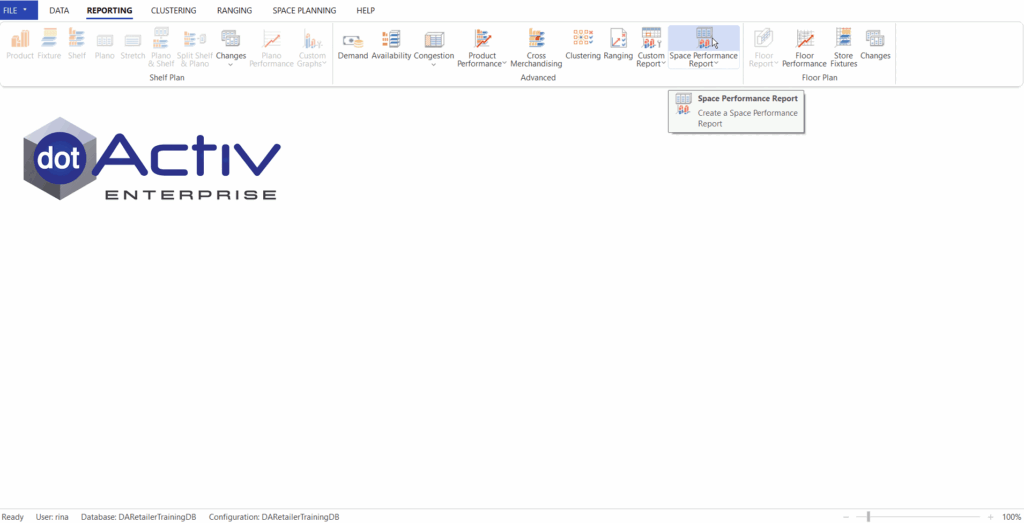
In the Reporting tab, select the Space Performance Report drop-down and click on KPI Targets.
Choose your Cluster Set and Category.
To add a new KPI target, click on Add, select the KPI that you want to set a target for, and click OK. After deciding on a new target, a pop-up will appear confirming that the KPI target is successfully saved. Click OK.
To edit an existing KPI target, click on the KPI target line. After deciding on a new target, a pop-up will appear confirming that the KPI target is saved successfully. Click OK.
If you are happy with the new targets set for your KPIs, click Close.
Step 2: Create Your Space Performance Report Configuration
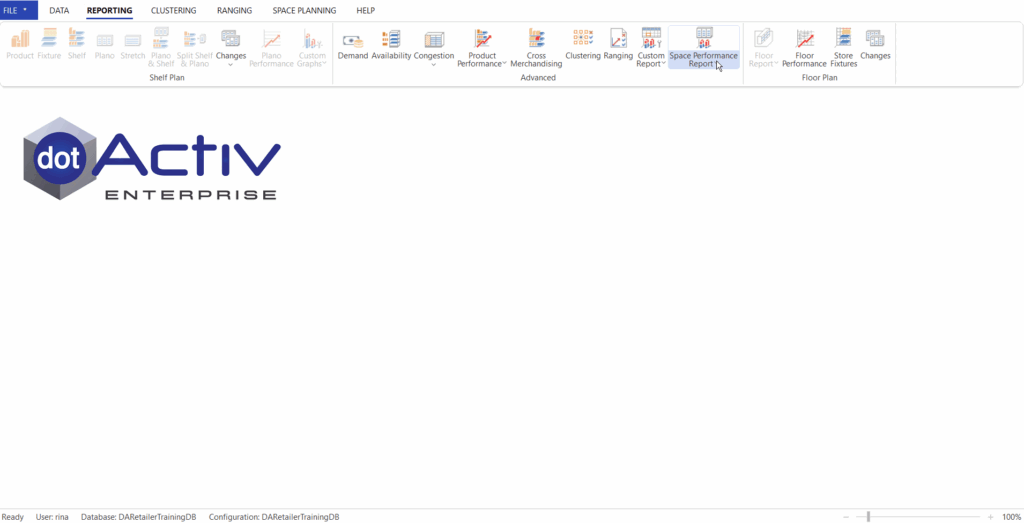
In the Reporting tab, click Space Performance Report. For a new configuration, select New.
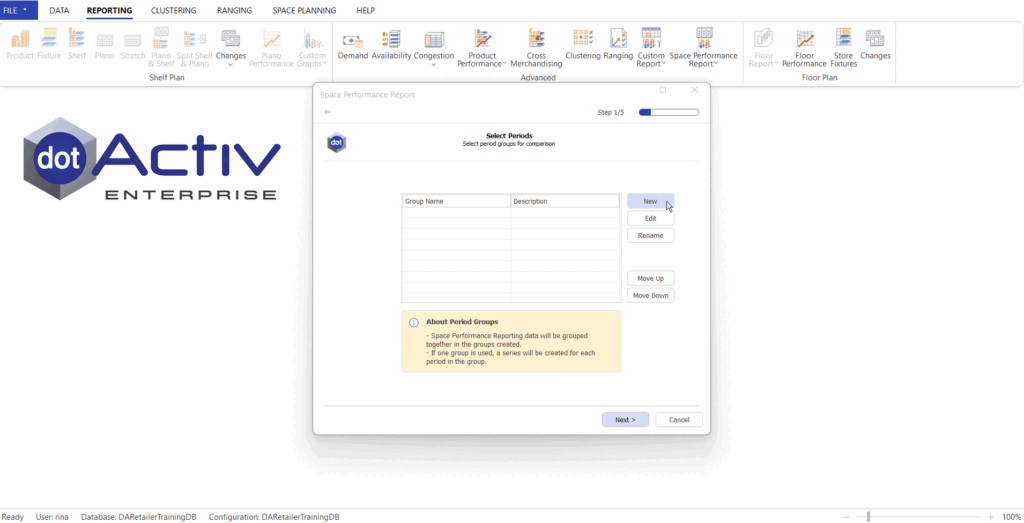
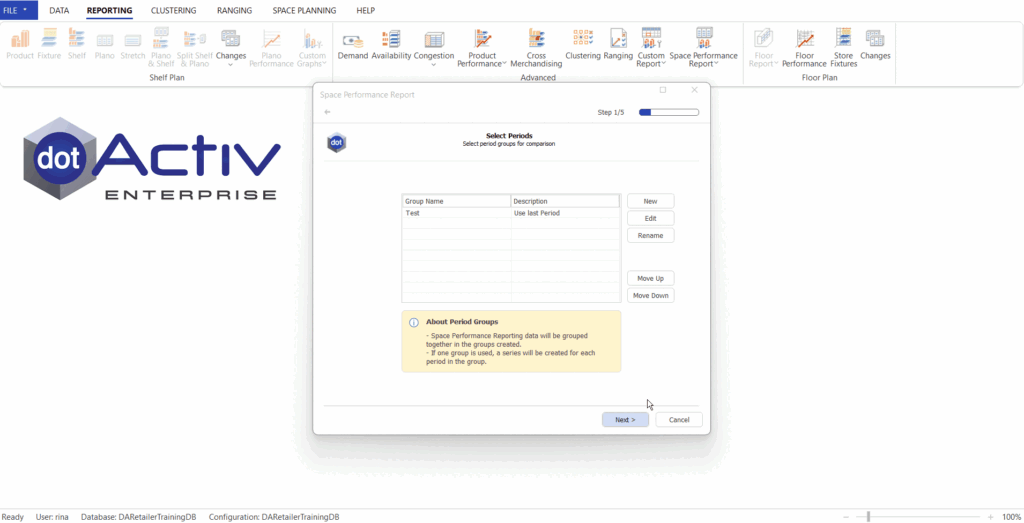
When setting up the report, a new period grouping should be created by the user. There are two different ways to configure the report based on the period settings. Firstly, a single period group results in a report per period in the data group. Whereas, a multiple-period group will group the data per period. Finally, the multiple period group can then be used to create a ‘Before’ and ‘After’ product groupings (or better known as a Period 1 and a Period 2).
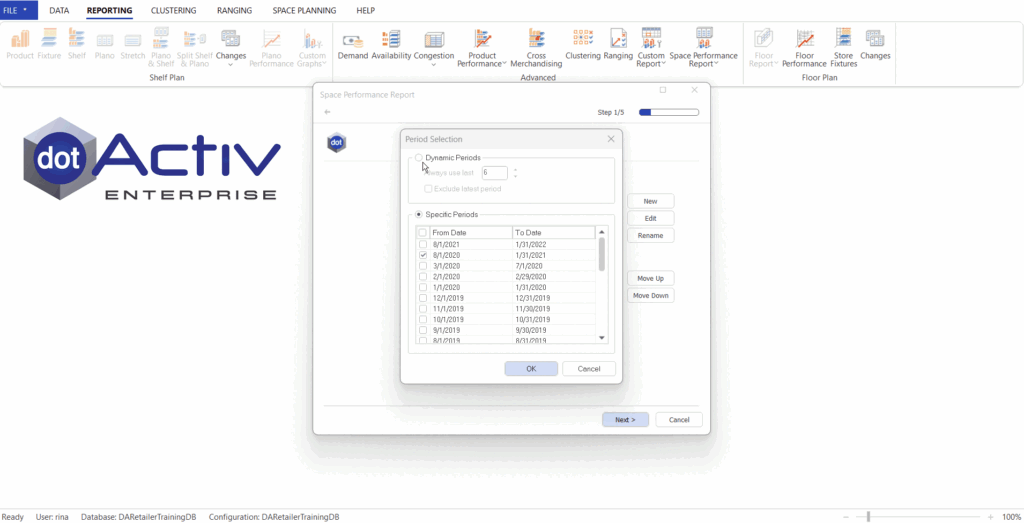
The first method is to click on Set, select Specific Periods, and tick the months you would like to include. Click OK.
Please note that Space Performance Reporting data will be grouped together in the groups created. If only one group is used, a series will be created for each period in the group.
The second method is to click on Set, select Dynamic Periods, choose the number of months you would like to include in your dynamic period and tick Exclude Latest Period, if applicable.
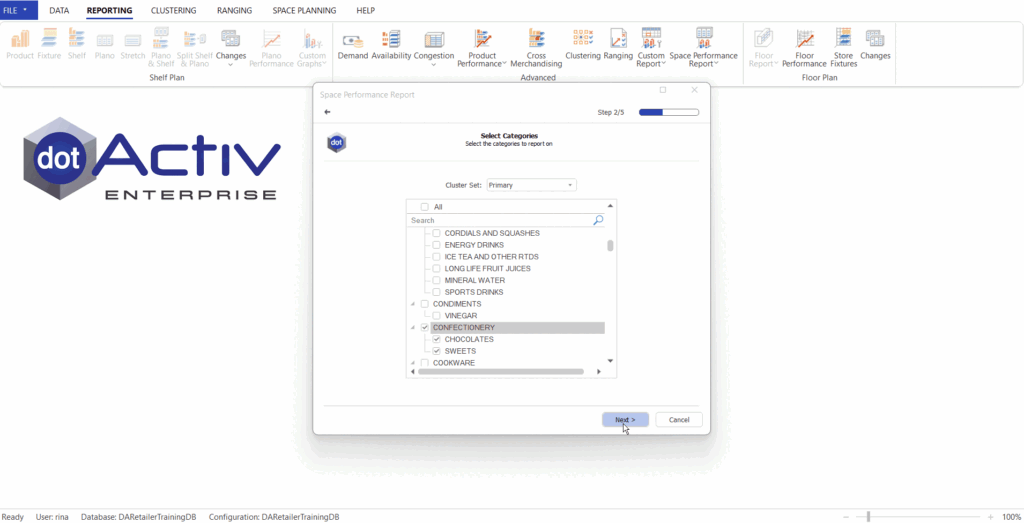
After clicking Next, select your Cluster Set and Category and click Next again.
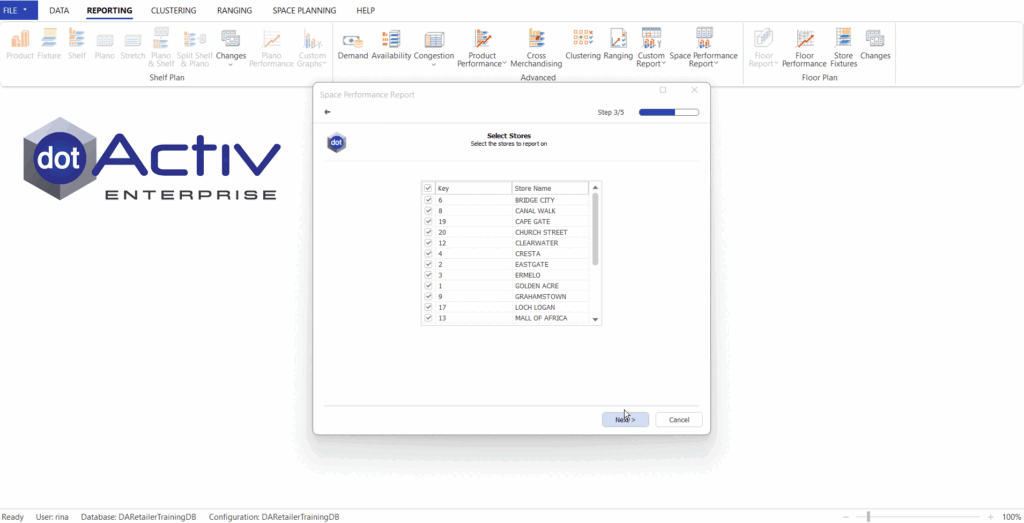
Select the stores that you would like to report on by ticking and unticking. Once you are happy with your selection, click Next.
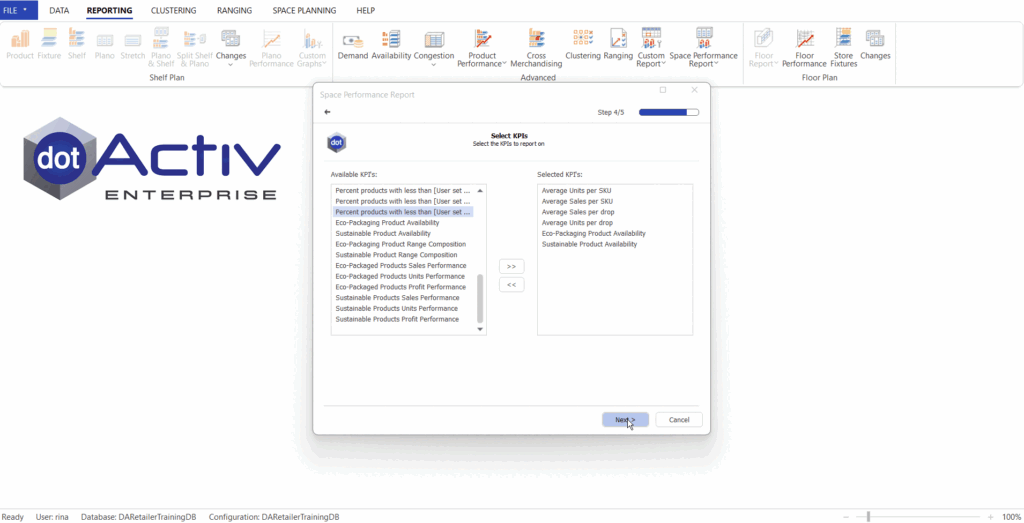
Select the KPIs you would like to report on by clicking on the KPI and then the right arrow. To remove a KPI, click on the KPI and then the left arrow. Click Next.
Select the Facts you would like to display next to the KPIs by clicking Add, selecting the KPI, and clicking Add again. To remove a KPI, click on the KPI and select Remove. Click Finish and name your configuration.
To edit your configuration, select the configuration and click Edit. To remove your configuration, select the configuration and click Delete.
Step 3: Open Your Space Performance Configuration
Select the configuration you would like to open and click Open.
Analyze your KPIs by clicking on the relevant graphs. To go to the previous page, click Back.
Notice that the target lines represent where the KPI target values are in comparison to the actual data.
