The purpose of this article is to provide you with a clear step-by-step process on how to set up a data cube while working in the DotActiv software.
Data cubes are the simplest means of extracting data from your database. You can easily extract data from your database by exporting your data cube to a CSV or XML file as unpacked below.
Please note that in the event that you would like to create another copy of an existing Data Cube, you can simply use the ‘Save As’ button after opening the cube on the same Database and rename it to your liking.
First, open the DotActiv application.
Next, navigate to ‘File’ and then ‘Setup’. In the drop-down menu, under ‘Database’, you can find ‘Data Cube’. Click on it to open the data cube setup window.
Alternatively, you can also open the data cube setup window by clicking on the ‘Data Cube’ icon in the Data ribbon, as seen in the GIF below.
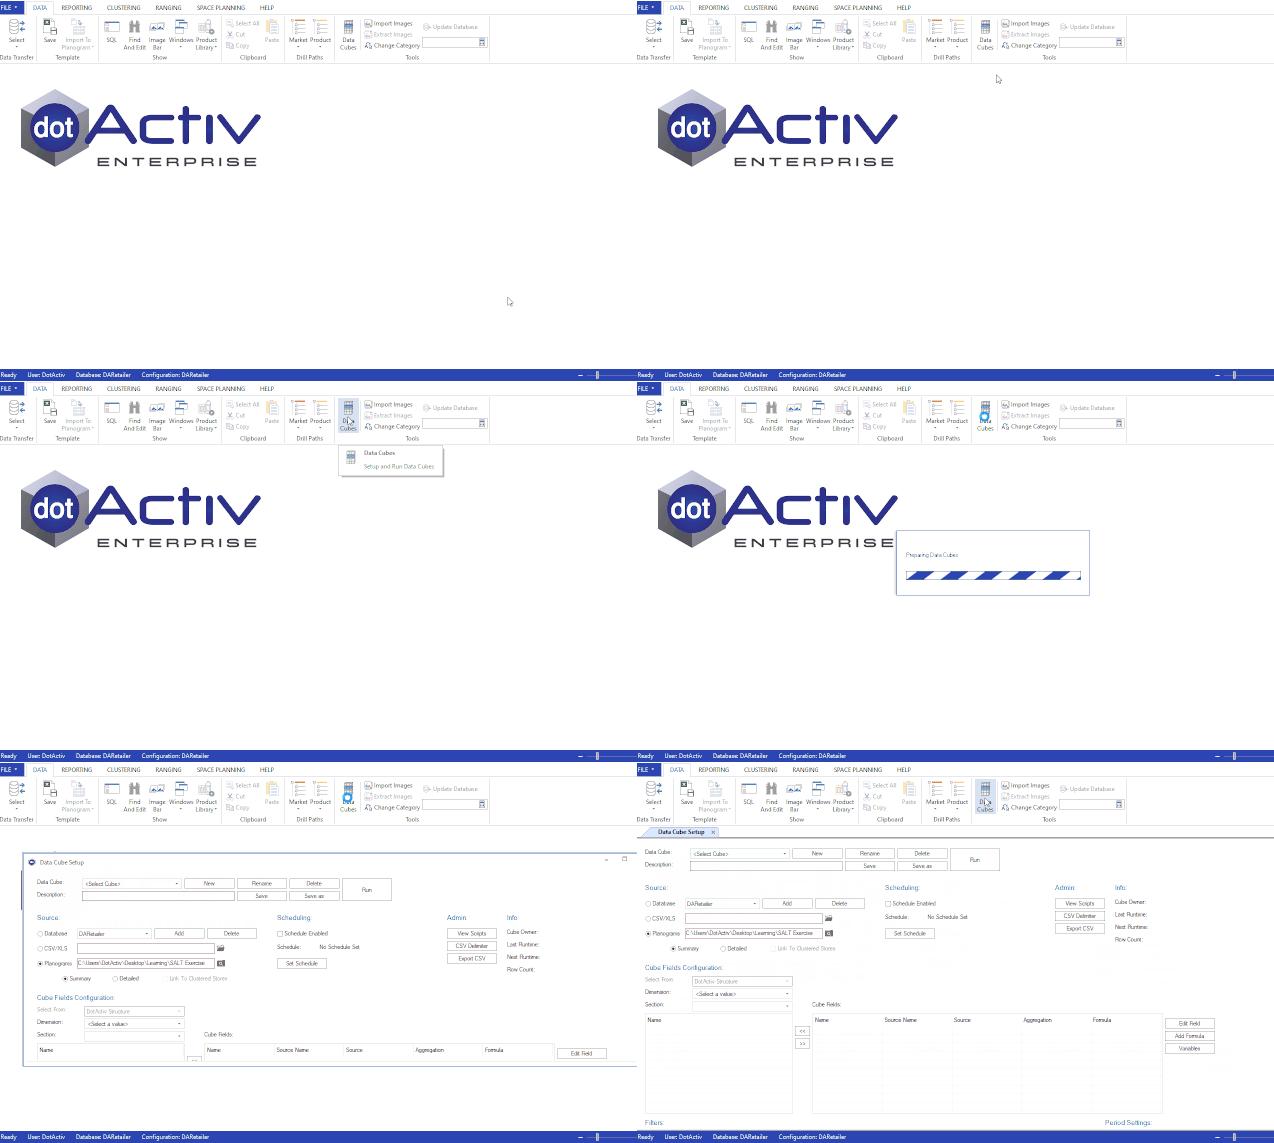
You can choose to create a new Data Cube or select one that you have set up previously. Clicking on the ‘Cube Name’ section brings up all the cubes that you or your colleagues have already created.
Setting Up A Data Cube
First, click on ‘New’ and enter a name. You can also enter a description for your cube if you wish.
From here, you need to select a source. You can choose to connect to a planogram, a CSV/XLS file or a database.
Data Cube Sources
As seen in the image below, there are three different types of data sources that can be used when creating a Data Cube.
- Database
A Database is the most commonly used data source as any piece of data can be retrieved which is stored within the DotActiv software, however, this does take some time to load.
The data structure includes the four fact fields i.e. Period, Product, Market and Fact as well as cluster and ranging information. You can also retrieve information from any other extra table that exists within the database.
- CSV/Excel
Pulling data from a CSV/Excel spreadsheet allows you to populate a Data Cube with data directly from the raw format which can be retrieved and populated in custom reports. This means that the data does not need to be imported into the DotActiv database structure nor a planogram beforehand.
Please note that when using a CSV as a data source, the data can only be retrieved if the user is connected to the local server.
- Planograms
A planogram would be used as a data source if the user would like to retrieve specific product information that is ranged on a particular planogram.
Using A Database To Setup Your Data Cube
In the ‘Source’ section, select ‘Database’ and choose which database you want to use. In this example, we chose ‘DARetailer’.
Next up, it’s time to select the fields that you want to add to your Data Cube.
For this example, we’ll add all the relevant ‘Market’, ‘Product’, and ‘Fact’ information to our data cube, all found under the DotActiv structure.
However, you have the option to add ‘Market’, ‘Product’, ‘Period’, ‘Fact’, ‘Ranging’, and ‘Clustering’ dimensions, as seen from the drop-down menu in the image below.
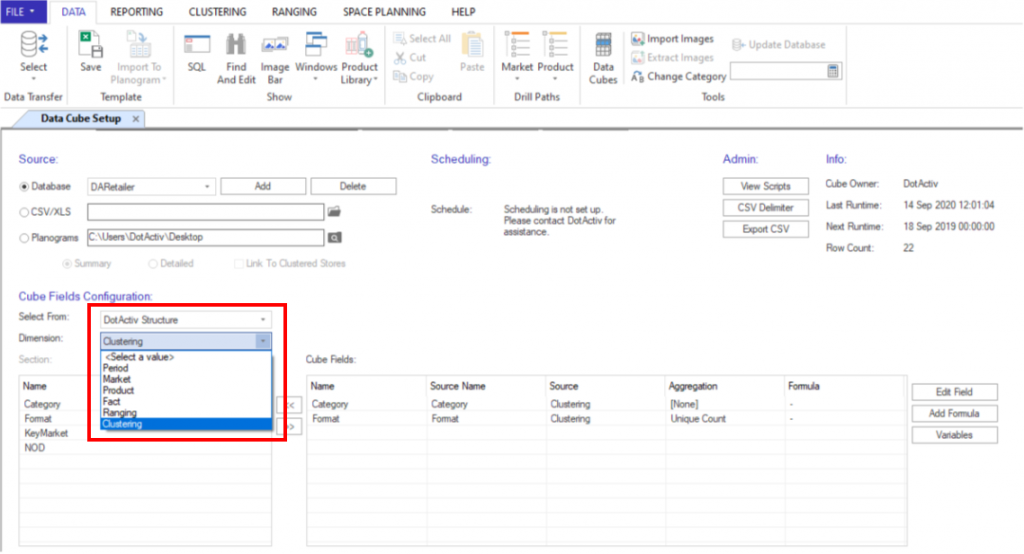
As per our example, after selecting the ‘Market’ dimension, select ‘Store Detail’ from the ‘Section’ drop-down menu, and add your fields. For ‘Store Detail’, that includes ‘Store Name’.
Note: To add your fields you can simply double click on it, or drag it over to the right in the ‘Cube Fields’ box.
Once you have added your fields to the ‘Cube Fields’ box, you can double click on a block within the ‘Cube Fields’ box to open the ‘Field Properties’ window. For example, if you double click on the empty block under the ‘Aggregation’ column, the ‘Field Properties’ window will open up as seen in the gif below.
As per the example above, you are now able to select which ‘Aggregation’ you would prefer to use in the ‘Field Properties’ window.
Please see the list of Aggregation types that you can choose from explained below.
- None: The results within your datacube will not be displayed or linked against any form of aggregation type.
- Sum: The Sum aggregate function returns the total amount of all selected values that you have set in the cube fields.
- Average: The Avg aggregate function calculates the average of the selected values that you have set in the cube fields.
- Minimum: The Min aggregate function returns the lowest value in the set of data selected in your cube fields.
- Maximum: The Max aggregate function returns the highest value in your set of data selected in your cube fields.
- Count: The Count aggregate function returns the number of rows that are included in your dataset according to the selected cube fields.
- Unique Count: The Unique Count aggregate function returns the number of distinct values within your dataset, instead of all the number of rows for the specified field.
Please note that each field can have its own independent aggregation type, which means that the selected aggregation type would apply to the selected field only and not to all fields.
In this window, you will be able to edit the ‘Field Name’, amount of ‘Num Decimals’, and choose if you would like to include ‘Aggregation’.
For this example, we selected ‘Unique Count’, as highlighted in the image below.
Once you are happy, you can click on ‘OK’.
Next is the ‘Product’ dimension, which has two parts. In the ‘Section’ drop-down menu, first select ‘Retailer Hierarchy’ after which you can add your various levels such as:
- Merchandising Group,
- Department,
- Category
- Sub-Category, and
- Segment.
Following that, we’ll select ‘Item Detail’ and add ‘Product Code’, ‘Barcode’, ‘Brand’, ‘Product Description’, and ‘Size & UOM’. After clicking on any field to add, a pop-up window gives you the option to edit it.
For the ‘Fact’ dimension, we’ll first select the ‘Retail’ section and then ‘Sales at Sell’ and ‘Sales Quantity’. Double click on the cube field for further field properties to appear i.e. easily include a related % field.
Lastly, there is the ‘Period’ dimension where you can add a ‘To Date’ and ‘From Date’.
To pull a data cube with multiple months of data into a single period, take out the From and To Date from your cube and add the Period field instead.
You will also see that you can select to add fields to the cube from ‘Views’. These views allow you to add calculated fields such as average price, profit, and gross margin.
If you are working with varying period lengths, you are also able to pull the different lengths of periods through if you choose to. For example, monthly vs daily period lengths. This can be done by simply selecting all the periods (i.e. daily and monthly) that you would like to use during the setup.
Using A Planogram To Setup Your Data Cube
Instead of choosing ‘Database’ in the ‘Source’ section, select your directory of planograms/FLP’s that you would like to pull your data from.

Please note that this feature pulls from a directory of planograms/FLP’s and not a singular file. It can pull from one file. In that case, ensure that you only have one planogram in your selected directory.
Once you have selected your planogram, click on ‘OK’. You can now continue setting up the Data Cube field configurations as well as any necessary filters.
You can choose from the following two options: ‘Summary’ or ‘Detailed’. As seen in the image below.

If ‘Summary’ is selected, the Data Cube will be populated with summarized records per gondola. On the other hand, if you select ‘Detailed’, the data cube will be populated with records per product.
When selecting ‘Detailed’, you can choose to tick the ‘Link To Clustered Stores’ box, as seen in the gif below. This means that for each product processed from the planogram, the Data Cube will be populated with a record for that product for each store it is clustered to. In other words, it duplicates the product info in the results with a distinction per store.
Please note that with the ‘Link To Clustered Stores’ checkbox off, instead, it just populates the data cube with a single record per product per planogram and does not expand that out for each store it is clustered in.
Adding Filters
The next step is to use the filter function at the bottom of the Data Cube setup window.
Let’s go ahead and choose our ‘Market’ dimension. We’ll add ‘Store Detail’ and select the name of the store we want to include in the report under ‘Value’. We’ll also filter by ‘Equal’ under the ‘Operation’ field.
Next, we’ll include the ‘Product’ dimension. For the sake of this example, we only want to report on the Baby Foods category, so we’ll choose ‘Retailer Hierarchy’ and ‘Category’. Under the ‘Value’ field, we’ll search for and select Baby Foods.
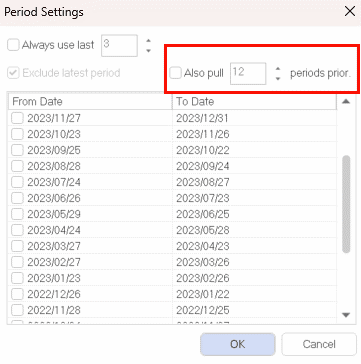
Finally, we must select a ‘Period’. The ‘Period Settings’ window pops up where you can click ‘Set Period’.
You have the option to use the last three periods or you can manually select your period. If you want to exclude the latest period, you can do so too. You might want to exclude the last period when you pull a report halfway through a month and don’t have all the information.
Please note that if you want to track growth, you should select prior periods.
Data Source Links
One of the more complex features of the Data Cube is allowing a joining of information from multiple database tables. With SQL statements, when retrieving information from multiple tables, one needs to specify what information from each of the tables relate to each other so that the all of the data can be correlated together in a meaningful way.
Data Cubes would need the same treatment in such a case. This is where data source links come in.
Please note that when adding fields to your cube that would warrant the need for a link, or when trying to save a cube that requires a link, the software shall inform you.
When only pulling data from the main DotActiv structure, no link is needed as the software knows how all of the data is connected. A link will typically be needed when wanting to include fields from a separate table.
See the example below, where we have added a few product fields from the main database structure and then we have added a field called ‘Product Status’ which comes from a separate table called ‘Product_Status’ (This table contains a product status value per product code).
When adding the product status field, we see the below popup.
Now we need to complete the link to inform the cube which column from the core DotActiv table structure contains data that will match data from which column in our Product_Status table, as those are the two data sources which need to link. Since both contain Product Code (and the values relate to the same products), we can link on those columns. With that in place, the product status values from our status’ table will correlate to the correct products in the resulting Data Cube.
Saving and Running A Data Cube
Once done, click ‘Save’.
Be careful. While you might have saved your cube, you haven’t run it yet. That means you haven’t yet populated your cube with data.
Then click ‘Run’ and choose when you want your cube to run. You can choose to run it immediately or at a later date, depending on your requirements.
Also, once you’ve run the cube, click ‘Save’ again.
Exporting to CSV
After running your cube, you can also export it as a CSV file to open and view it at a later date. To do so, click on ‘Export CSV’.
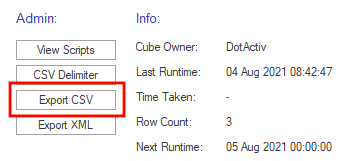
You will be prompted to select an output directory in the next window. Select any directory to your liking and click “OK”.

You can now open the CSV from your chosen folder and view your data whenever you want.
Exporting to an XML
After running your cube, you can also export it as an XML file to open and view it at a later date. To do so, click on ‘Export XML’.
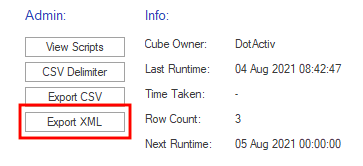
You will be prompted to select an output directory in the next window. Select any directory to your liking and click “OK”.

You can now open the XML file from your chosen folder and view your data whenever you want.
Troubleshooting – Data Cube is not pulling any data or unable to connect to my Data Cube
Once you have set everything up and ran your datacube and you discover that your data is not pulling all or any of your data, you can have a look at the following:
- Make sure that the period of data you have selected does exist in your SQL database.
- Ensure that there are no unnecessary filters that you have not applied, on your Data Cube.
- If you ever come across an error where you are unable to connect to a Data Cube using the database option, ensure that your correct database setting is configured.
Troubleshooting – Data Cube is not pulling any data
Once you have set everything up and ran your Data Cube, and you discover that your data is not pulling all or any of your data, you can have a look at the following:
- Make sure that all your planograms contain all the data from your key fields. I.e, Product ID, Store ID, where applicable.
- Ensure that there are no unnecessary filters that you have not applied, on your Data Cube.
- Check that the DotActiv software has access to the directory on which your planograms are saved.
From here, you can begin building a custom report and report on your retail data. Should the above steps not work for you, please create a support ticket and our support team will assist you in uncovering the issue.
