This article will provide you with a step-by-step process to generate a planogram manually in the DotActiv software. We also discuss how to save the planogram that you have created.
Generating A Planogram
When manually generating a planogram in DotActiv’s software, you do not need to be connected to a database.
In the event that you would like to create a realogram, you can follow the same process as listed below. However, the exact flow of the store display should be copied.
Steps To Building A New Gondola
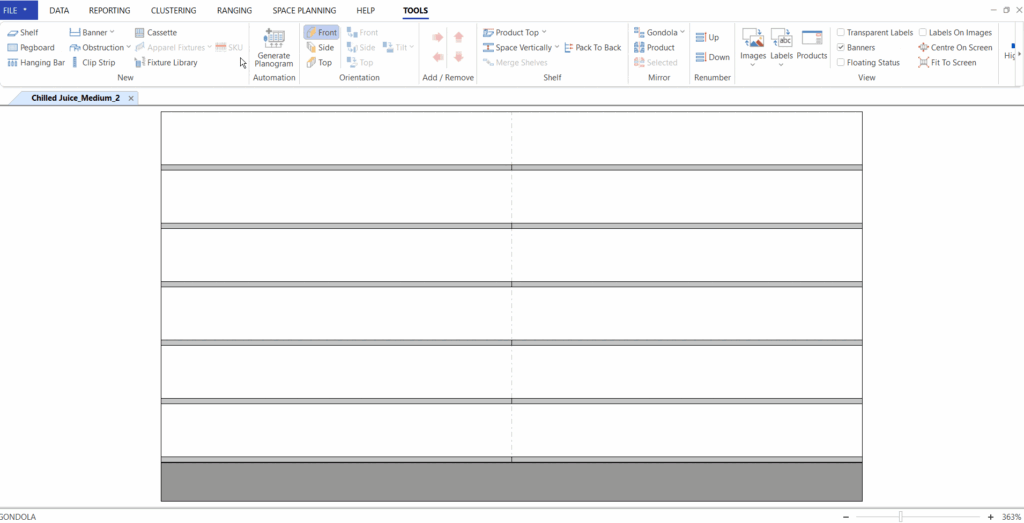
1. Open the DotActiv application, click on the ‘Space Planning’ tab and then click on ‘New Gondola’. Your gondola will house the planogram that you plan to create.

2. A pop-up screen will appear prompting you to name your file and add the needed gondola dimensions and information. Be sure to have all the necessary information and to name the gondola with the correct naming conventions.
In the example below, we have used the following naming convention – CATEGORY_NOD. As seen next to ‘File Name’, we use ‘Salt’ as our category and ‘2’ to indicate the number of drops on the planogram. Alternatively, you can also incorporate your clusters into your naming convention. In such a case, the naming convention would look like this – CATEGORY_CLUSTER_NOD.
Please note that you should always ensure that all naming conventions of your planograms are exactly the same, down to the last letter. Any reporting, importing or pulling of data is very sensitive to this. The slightest change to the name could prevent the data from pulling through properly. Also, check for any spacing between letters or words.

3. Once you have filled in the information, click ‘Add & Close’.
Steps To Create The Planogram
1. In the Data tab, click on ‘Select’.
2. Choose ‘CSV to Shelf Plan’.

3. Import your data using the following steps:
- Click on ‘Open file’.
- Select the CSV and click ‘OK’.
- A File Settings pop-up screen will appear; ensure that ‘Comma’ is ticked under the separator and then click ‘OK’.
- Using the AutoMap function, click on Markets, and then select ‘Automap’.
- Repeat for Product, Fact and Periods.
- Select Import and click ‘OK’.
4. Under the ‘Tools’ tab, click on the ‘Images’ icon to turn the images on.
Turning on the image function makes it easier to identify products according to brand, segment and size.
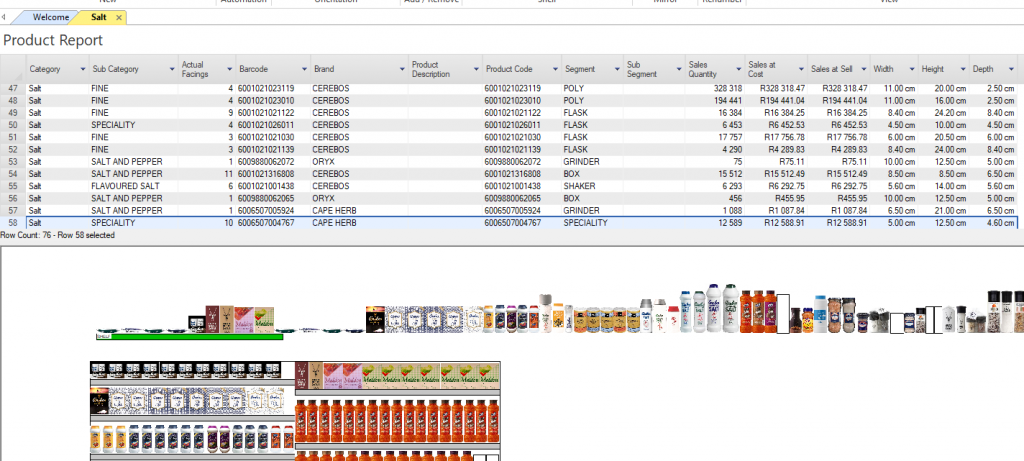
5. Under the ‘Reporting’ tab, click on the ‘Product’ report

6. Drag the products from the green shelf onto the relevant shelf of the planogram. If you cannot see the screen shelf, it is most likely under the shelf report. If you are experiencing this, scroll up to see the floating shelf.

The product report indicates the product information including the sub-category, description, brand and segment which assists you in allocating products to shelves and ensuring that a flow is followed.
7. Add and remove as well as move shelves around to make space for all the products on the planogram.
8. To add a shelf, click on the ‘Tools’ tab, and then select the ‘Shelf’ icon. Drag the shelf to where you would like it to be.
9. To remove a shelf, click on the shelf and press delete on your keyboard. For Mac users, hold Command and Backspace.
10. To move a shelf, click and drag the shelf with the mouse to the desired position.
11. You also have the option to add additional fixtures to your planogram such as pegboards, hanging bars, banners, obstructions, and clip strips. Please see the screenshot below.

Learn how to create different fixtures in this article here.
12. Once you have built your gondola and added your fixtures and products, the next step is bringing your planogram to life through images. However, it is important that you ensure your images are clean and formatted correctly before you can do so. In this article, we explain how to clean and prep your images before you import them into the DotActiv software.

13. You can now import your images into the DotActiv software. There are a few different ways to do this and we have listed them in this article. Should these steps not work for you, read more about the format that your image should be in when importing and what to do if your images are not importing.
Generating a planogram manually may be more time-consuming than planogram automation. However, you can use this approach to get to know the products within your display hierarchy better; especially if you’re working with a new category.
Saving A Planogram
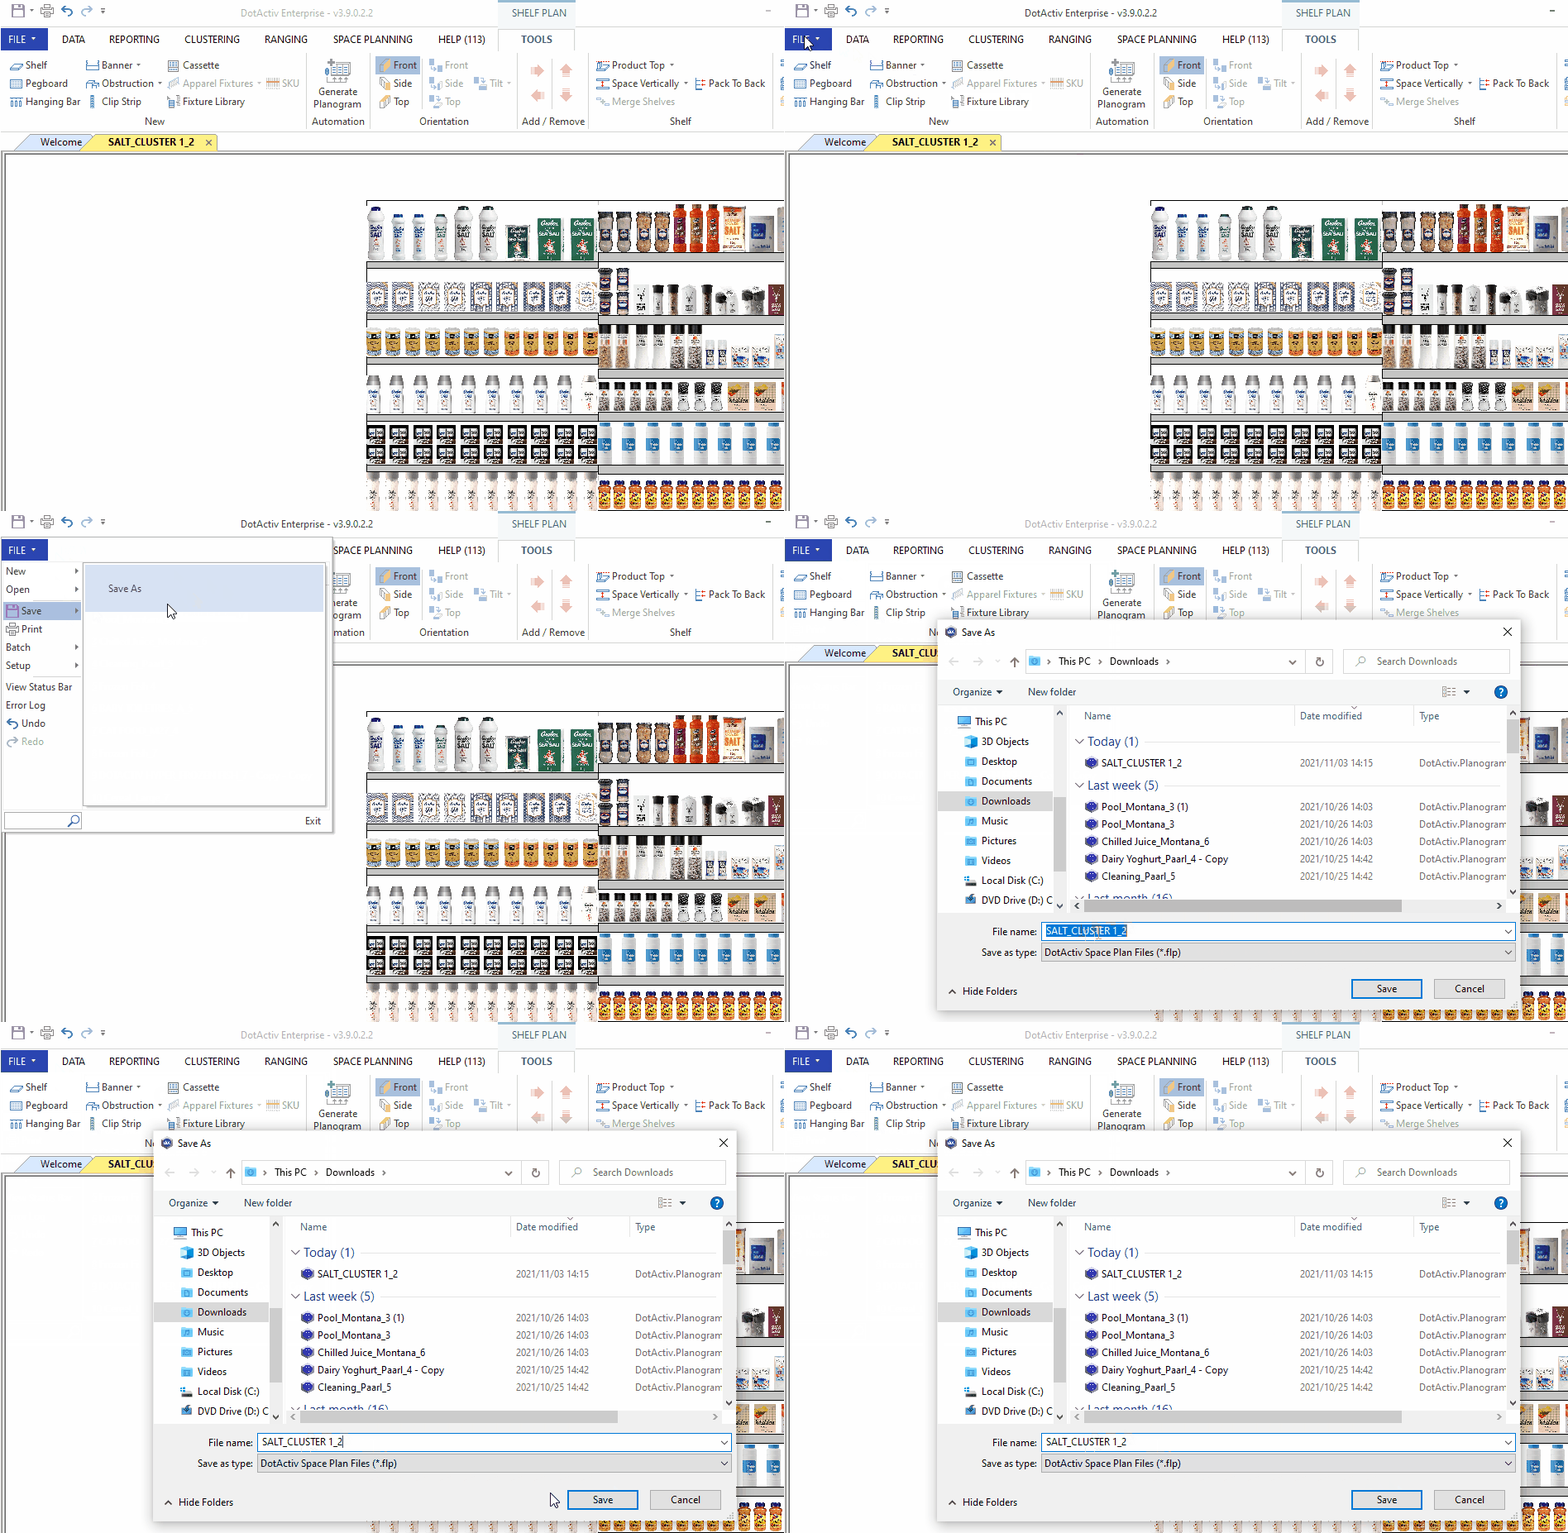
Once you are happy with the planogram that you have created, you can save the planogram.
To do so, simply navigate to ‘File’, and click on ‘Save’ and then ‘Save As’ to save the planogram, as seen in the gif below.

If the above steps do not work for you, please log a ticket for our IT Support team who is always willing to help.
