The purpose of this article is to offer you a clear step-by-step process to add a cluster plan to a custom report while working in the DotActiv software.
Adding A Cluster Plan
After opening the DotActiv software, ensure you are in the ‘Reporting’ tab.
Once there, navigate to the ‘Advanced’ section and click on the drop-down arrow next to ‘Custom Report’. Select ‘Report Builder’.
The ‘Custom Report Builder – Templates’ window appears. Here, you can either choose an existing template or create a new one.
After selecting your chosen report, you’re taken to your report.
You can add a clustering data source by clicking on ‘Data Sources’ found under ‘Tools’. There are also filters on the product fields when setting up a cluster plan data source. Please see the video below for the exact steps.
Once you have done this, navigate to your left-hand pane. On the left, you will find dockable windows labelled ‘Objects’ and ‘Clustering’. Click on ‘Clustering’, as seen in the screenshot below.
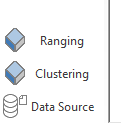
You will now be presented with additional add-ons seen in the screenshot below.
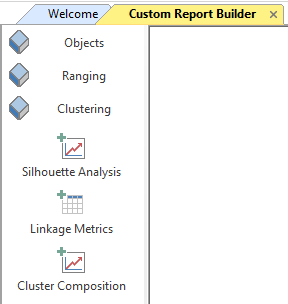
Add the Silhouette Analysis, Linkage Metrics or Cluster Composition by first clicking on the add-on and then the page you want to add it to. We will unpack these add-ons below.
Silhouette Analysis

The ‘Item Properties’ window will appear if you add the ‘Silhouette Analysis’.
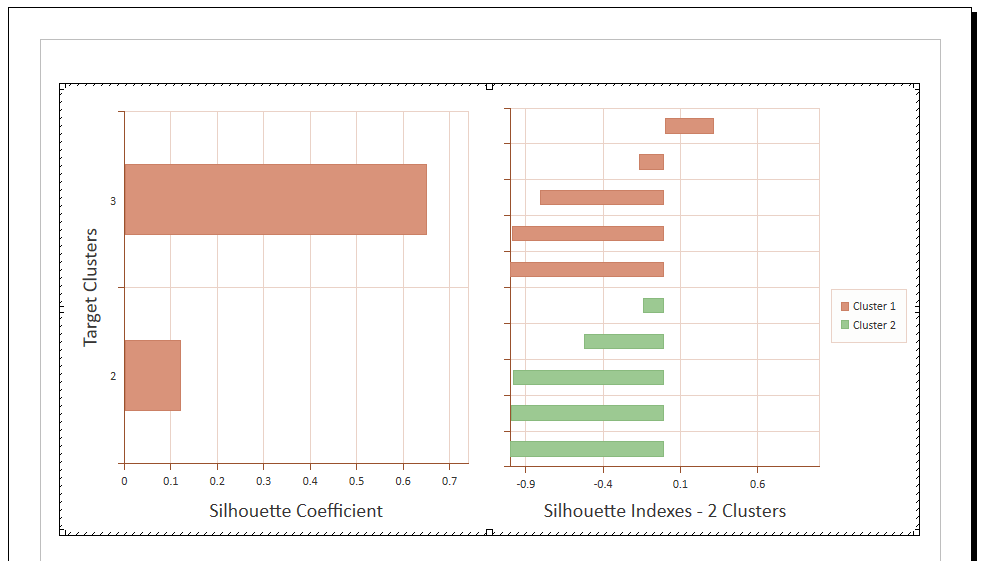
You can add or edit the data source by using the ‘Add/ Edit’ button. Once happy, press ‘OK’. The Silhouette Analysis will appear, as seen in the example below.
Linkage Metrics

The ‘Item Properties’ window will appear if you add the ‘Linkage Metrics’.
You can add or edit the data source by using the ‘Add/ Edit’ button. Once happy, press ‘OK’. The Linkage Metrics will appear, as seen in the example below.
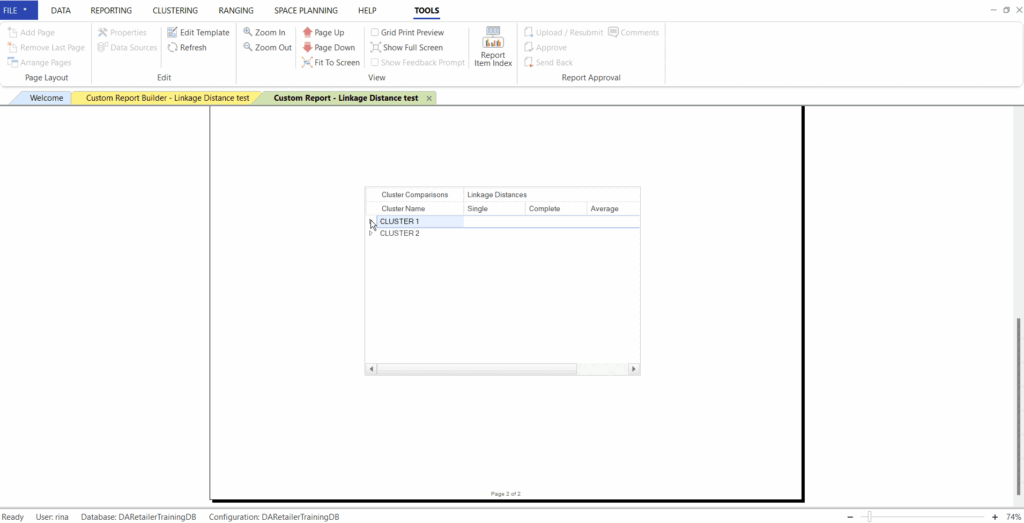
The user can then compare each available cluster to the rest using the single, complete, average and medoid linkage distance.
Cluster Composition
The ‘Item Properties’ window will appear if you add the ‘Cluster Composition’.
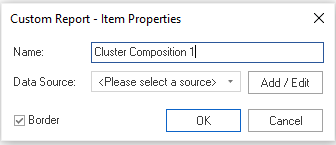
You can add or edit the data source by using the ‘Add/ Edit’ button. Once happy, press ‘OK’. The Cluster Composition will appear, as seen in the example below.
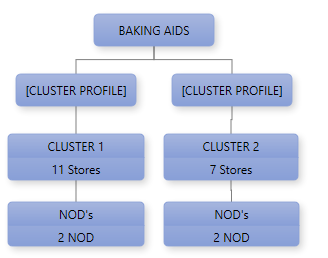
You can make changes to the text in the structure and resize and move the boxes around on the page.
Once you’ve linked a cluster plan and generated the report, you can make further changes to the structure, for instance, adding the Cluster Profile for each cluster.
Once done adding all the clustering objects, you can save your custom report.
How To Generate A Report And Link A Cluster Plan
Once you have added the relevant range reports to your template, you can link an existing cluster plan.
To create a report with your range plan, go to ‘Reporting’, ‘Custom Report’ and select ‘Generate A Report’. Choose your saved template as you created according to the steps above and link your range plan to the custom report as per the below GIF.
Learn more about how to create a custom report in this article linked here.
If the above steps do not work for you, please log a ticket for our IT Support team who is always willing to assist.
