The purpose of this article is to explain how you can create an advanced report on saved versus existing ranges in DotActiv software. This function summarises changes on current versus proposed ranges.
Reporting On Ranges
After opening DotActiv, ensure you are in the ‘Reporting’ tab. Next, click on the ‘Ranging’ icon in the ‘Advanced’ section.

Clicking on the ‘Ranging’ icon will result in the ‘Range Optimizer – Reporting’ window to appear, as seen below.

In the top right-hand corner, you can ‘Filter By Category’. You can select a range plan (or run) by selecting the name. Then you can choose to either view the report or view a summarised version.
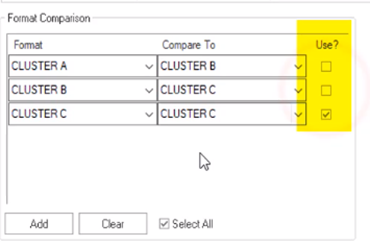
You can also compare a new plan with a current live range or add more fields by clicking on the ‘Add’ button underneath the ‘Format Comparison’ window.
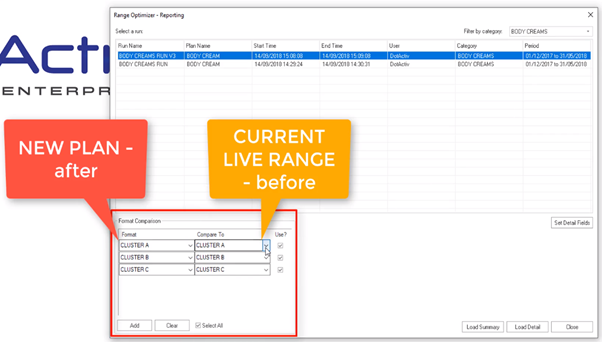
Once you have populated this section, make sure you have selected the checkbox under the ‘Use’ section.
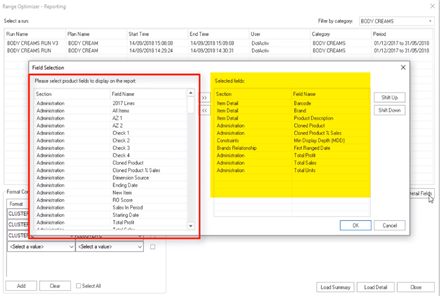
Before running a detailed report, you must first set the details. To select a field, click on it and drag it from the ‘Fields Selection’ section to the ‘Selected Fields’ section. You can also double-click on your desired field to move it.
Load Summary
When selecting ‘Load Summary’, the following window appears.
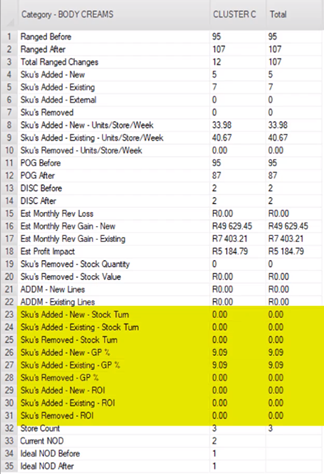
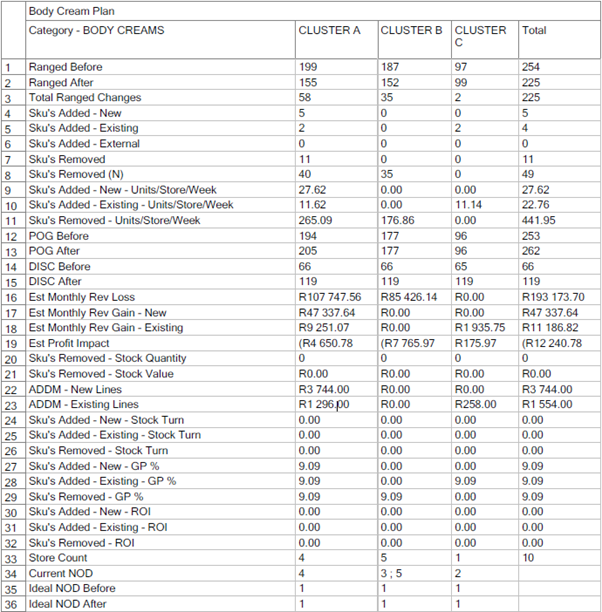
Here, you can view various fields for analysis. For example, you can view the DISC before and after indicator, which shows the number of discontinued products.
You can view the SKU’s added and removed indicators, which shows you how adding or removing SKU’s impacts stock turn, gross profit and more.
You can convert the summary report to a PDF for a simpler view, as seen below.
Load Detail
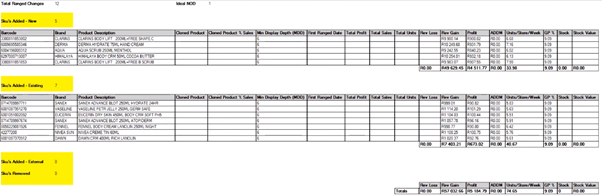
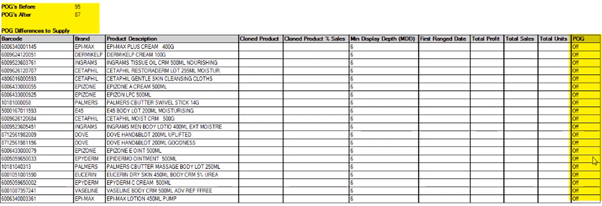
When selecting ‘Load Detail’, you can view an in-depth report, as seen below. This report includes fields such as Product Code; Product Description; Revenue Loss; Revenue Gained; Profit; ADDM; and Gross Profit Percentage.
You can also see the plan name and the selected category format.
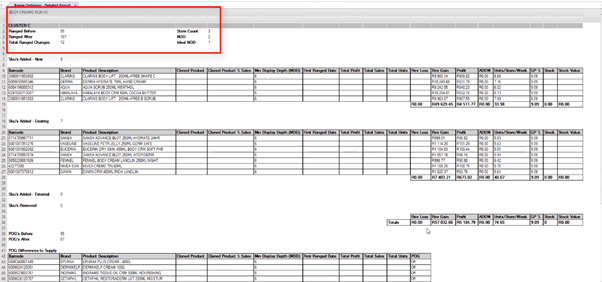
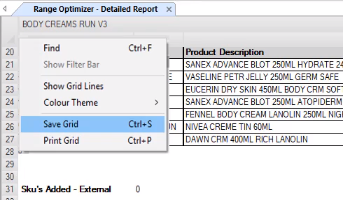
Below that, you can see the ‘SKU’s Added – New’, ‘SKU’s Added – Existing’ and ‘SKU’s Added – External and ‘SKU’s Removed’.
The Ranging Report is a valuable tool to measure GMROI as it assists you in deciding which products to stock.
Below that, you can see ‘POG’s Before’, ‘POG’s After’ and ‘POG Difference To Supply’ indicators. This section of the report will show you when a planogram (POG) indicator is on or off and when it’s on or off for supply.
By right-clicking on the top left corner of any of the above grids, you can save your report as a CSV, Excel file or print it to PDF.
We suggest that it is best to review these changes before each plan is implemented in your business, as range changes can either cause the retailer to lose profits or increase profits.
Should the above steps not work for you, please create a support ticket and DotActiv support will assist you in uncovering the issue.