The purpose of this article is to explain how to compare proposed versus existing planograms in DotActiv software to show the overall performance of a product.
Using The Product Performance Report
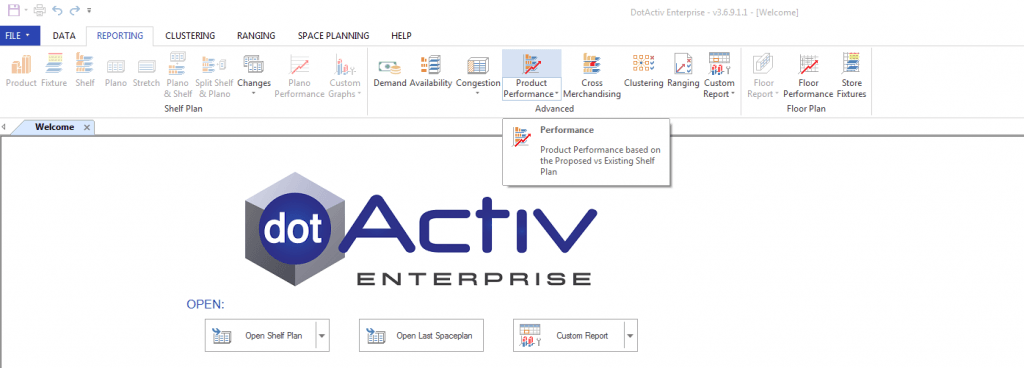
After opening DotActiv, ensure you are in the ‘Reporting’ tab. Next, click the ‘Product Performance’ icon found in the ‘Advanced’ section.

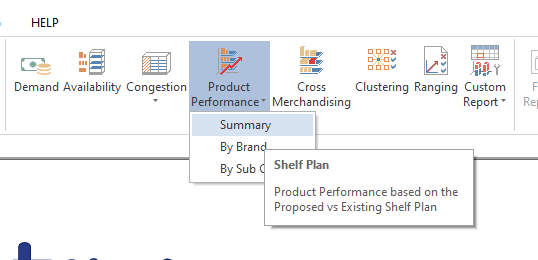
If you click on the ‘Product Performance’ icon, you’ll find that you can run your report :
- As a Summary;
- By Brand; or
- By Sub Category

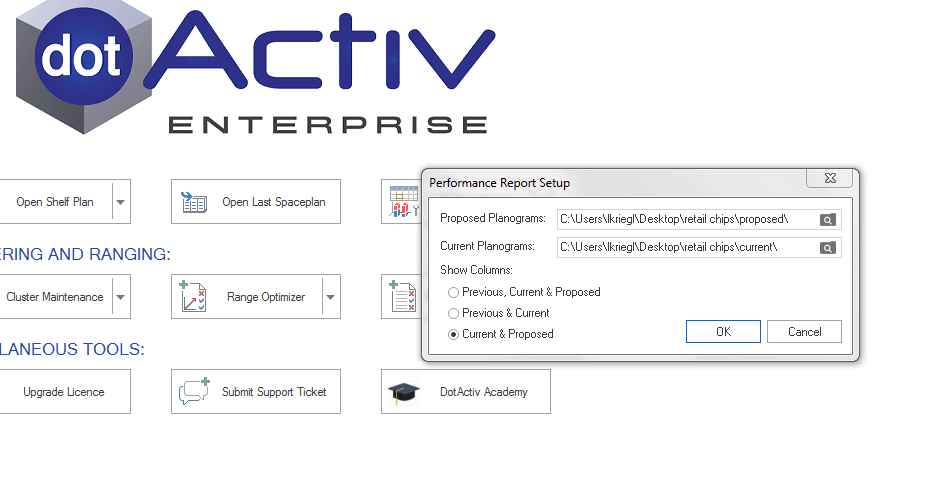
Selecting any of the three options will result in the ‘Performance Report Setup’ popping up. Here, you can select the proposed planogram and the current planogram that you want to compare.
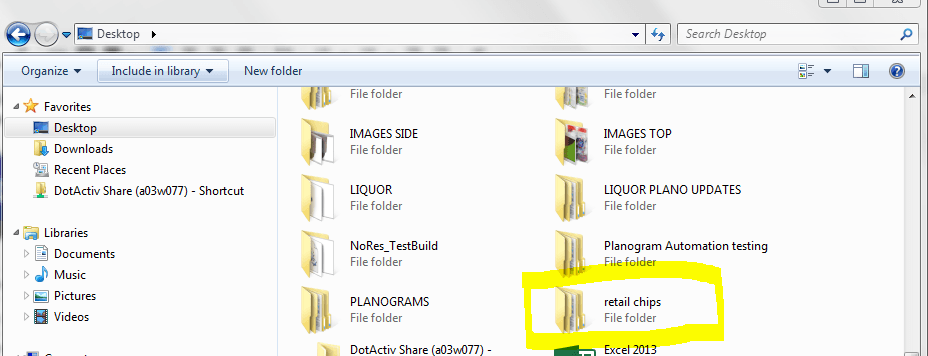
You need to have saved the planograms in the same folder but named differently – ‘proposed’ and ‘current’


Click ‘OK’.

As seen above, the report provides you with a summary of changes in your current versus proposed planograms.
Should the above steps not work for you, please create a support ticket and DotActiv support will assist you in uncovering the issue.
