The purpose of this article is to provide you with a step-by-step process to create a report template in DotActiv software.
Before you read this article, it’s important to know the difference between the ‘Report Builder’ and ‘Generate A Report’ function.
The ‘Report Builder’ function refers to building a report template, whereas the ‘Generate A Report’ function refers to generating a report by mapping information from a data source (either a data cube or planogram) to the template you have created in ‘Report Builder’.
For example, you might have created a custom report template with ‘Report Builder’. Within this template, you have inserted a 2D Clustered Column graph indicating the %Sales and %Units per sub category.
On the template, you will see the graph showing ‘Sub Category 1’, ‘Sub Category 2’ and so on in the X-axis. Now, let’s say you have created a Chips planogram and classified the sub categories to be Potato Chips, Hard Extrudes and Soft Extrudes.
The moment you generate a report by linking the Chips planogram and its data to the template you built, the same 2D Clustered Column graph will appear, but this time, the X-axis will show the planogram’s ‘real’ sub-categories (in this case Potato Chips, Hard Extrudes and Soft Extrudes). The real sales and units data will also pull through.
The ‘Report Builder’ helps you to build an outline or example of a report you would like to see when using real data.
Whether it’s the graph, grid or planogram that you set in your report template (explained below), the moment you generate a report by linking a data source to the template, that data source’s data slots into the template. The template then adjusts to generate a report with real data.
Setting Up Your Reporting Template
After opening DotActiv, ensure you are in the ‘Reporting’ tab.
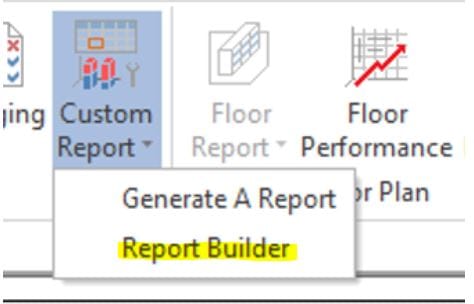
Once there, navigate to the ‘Advanced’ section and click on the drop-down arrow next to ‘Custom Report’. Select ‘Report Builder’.

The ‘Custom Report Builder – Templates’ window appears. Here, you can either choose to create a new template or use an existing template.
Creating A New Template
A user would want to use this option when they are either creating their first custom report template, or if they need to create a template where the layout and information that needs to display are different to any other previously created custom report template. This option is used when you want to begin with a blank canvas.
To do this, you need to follow these steps in DotActiv:
Step 1: Select ‘Custom Report’ and then ‘Report Builder’.
Step 2: Click the ‘New’ icon.
You are now ready to start. Remember to save the template when you are done to link the relevant planogram/data cube’s information to this report when generating the report.
Using An Existing Template
A user would want to use this option if they want to create a new custom report but don’t want to begin from the beginning. This option works best in the case where you want to build a report template that is similar to one you have created, but with minor tweaks.
For example, let’s say you have created a report template (as explained above) and saved it. You now need to run a new report, which requires the exact same layout (in terms of the information provided and the order thereof).
However, where the previous template’s graph indicated %Sales and %Units per Brand, you now need the new report to illustrate %Sales, %Units and %Cubic Space per Sub Category. This would be the perfect example to create a new custom report from an existing template.
To do this, you need to follow these steps in DotActiv:
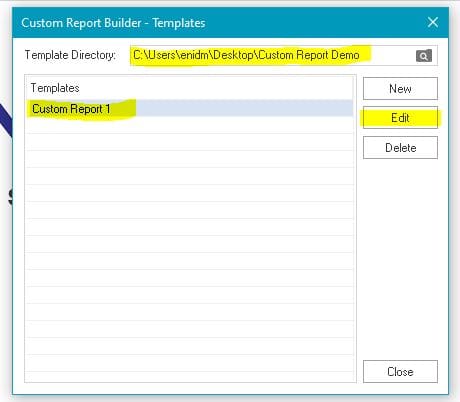
Step 1: Select ‘Custom Report’ and then ‘Report Builder’.
Step 2: Select the directory of the report template you want to use as a base and click on ‘Edit’.
Step 3: Make the necessary adjustments. In this case, it would be to change the ‘Set Data’ of the graph.
Step 4: After you are satisfied with the changes, click ‘Save As’ (not ‘Save’ as doing so will overwrite the old template) and select a directory where you’d like to save the new template.
The ‘Custom Report Builder – Templates’ window will appear. If you have saved the new report template to the same directory as the previous report template, it should look like the following:
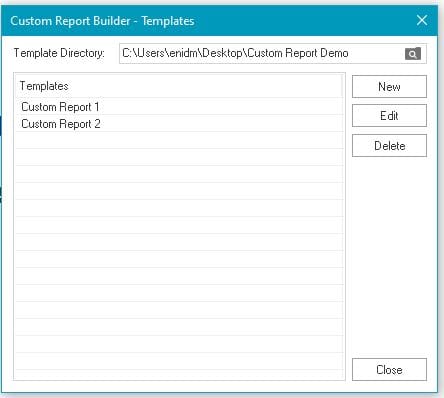
Please note that the template names are the names you create for the templates while saving them. It won’t be ‘Custom Report 1’ or ‘Custom Report 2’ unless you name it that way.
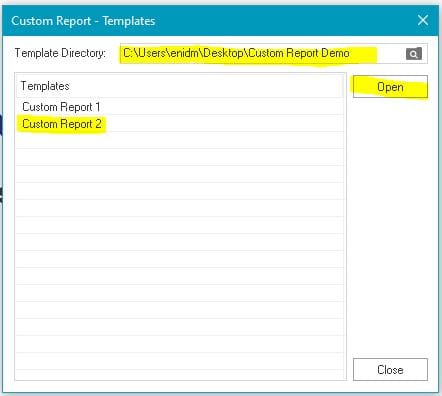
Step 5: You can now import / link planogram information to the new report template with the ‘Generate A Report’ function (see image at the beginning of this article). You can do that by selecting the relevant directory, the new report template and on ‘Open’.
After selecting your chosen report, you’re taken to your report. On the left, you’ll find a dockable window labelled ‘Objects’. Objects can be added and pinned in place to prevent accidentally moving them while setting up templates.
From this window, you can add the following:
Using all of the above elements, you can set about creating your report specific to your requirements.
Should the above steps not work for you, please create a support ticket and DotActiv support will assist you in uncovering the issue.